

行业解决方案
查看所有行业解决方案
IDA 用于解决软件行业的关键问题。
发布时间:2023-06-02 14: 29: 49
Action name:TracingWindow
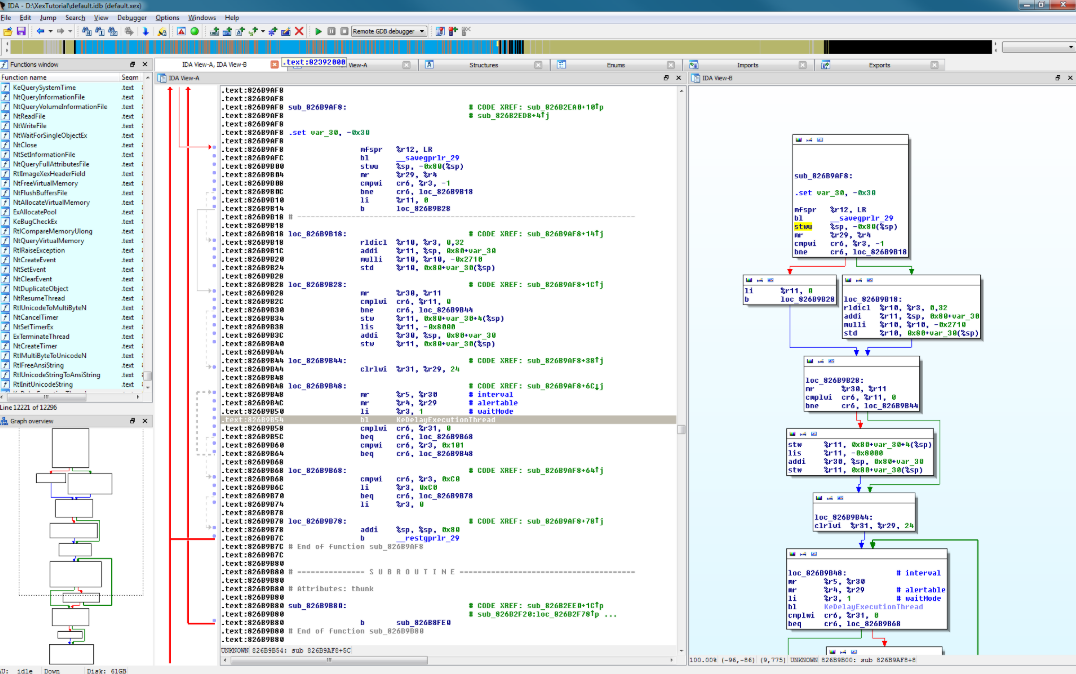
Opens the'Tracing'window.
In this window,you can view some information related to all traced events.The tracing events are the information saved during the execution of a program.Different type of trace events are available:instruction tracing events,function tracing events and write,read/write or execution tracing events.
During the execution,the list of traced events is disabled,as it couldn't be continuously synchronised with the execution without rendering the whole tracing very slow.
If a'='character is displayed in the'Thread'and'Address'columns,it indicates that the trace event occurred in the same thread and at the same address as the previous trace event.
See also Clear trace
Instruction tracing
Function tracing
Basic block tracing
Add write trace
Add read/write trace
Add execution trace
Tracing options
Tracing submenu.
中文翻译:
操作名称:TracingWindow
打开“跟踪”窗口。
在此窗口中,您可以查看与所有跟踪事件相关的一些信息。
跟踪事件是程序执行过程中保存的信息。
可以使用不同类型的跟踪事件:指令跟踪事件,函数跟踪事件并写入,读/写或执行跟踪事件。
在执行期间,跟踪事件列表被禁用,因为它不能在不渲染整体的情况下持续与执行同步跟踪非常慢。
如果'Thread'和'Address'列中显示'='字符,则表示跟踪事件发生在与前一个跟踪事件相同的线程和相同的地址。
另见清除痕迹
指令追踪
函数追踪
基本块跟踪
添加写入跟踪
添加读/写跟踪
添加执行跟踪
跟踪选项
跟踪子菜单。
展开阅读全文
︾
专业销售为您服务

读者也喜欢这些内容:
IDA Pro反汇编代码怎么加注释 IDA Pro反汇编代码怎么导出成文本
在IDA Pro里做静态分析,注释是把你的判断依据固定下来的关键动作,后续复盘、交接、做对比数据库时都靠它来省时间。导出成文本则更偏向分享与留档,既可以把当前反汇编视图写成可读的清单,也能按需要导出成ASM或LST文件,便于外部检索与对照。...
阅读全文 >
IDA怎么变成伪代码 IDA伪代码插件怎么用
在逆向分析过程中,阅读原始汇编指令对大多数分析人员而言既耗时又容易出错。为了更直观理解程序逻辑,IDA Pro提供了将二进制代码转换为伪C代码的功能,辅以伪代码插件的使用,可以极大提升阅读效率和逻辑理解能力。围绕“IDA怎么变成伪代码,IDA伪代码插件怎么用”,本文将详细介绍IDA Pro伪代码生成的步骤、插件配置方法实用技巧,帮助用户从基本功能到高级使用实现高效逆向分析。...
阅读全文 >
IDA Pro调试过程中查看基址 IDA Pro调试多线程的解决方法
在逆向分析和漏洞挖掘的过程中,IDA Pro作为业界广泛使用的静态与动态分析工具,承担着极为关键的角色。尤其在调试环境中,程序基址的准确获取与线程调度的合理处理,将直接影响整个分析流程的准确性与效率。对于初中级用户而言,“IDA Pro调试过程中查看基址”与“IDA Pro调试多线程的解决方法”常常是易出错、高频卡顿的问题节点。本文将围绕这两个核心环节,进行实操级别的详细解析,并进一步延伸说明IDA Pro如何借助Trace功能还原函数调用路径,以帮助使用者构建完整调试体系,提升静动态结合分析的深度和广度。...
阅读全文 >
IDA Pro怎么做动态分析 如何实时监控IDA Pro的程序执行
嘿!如果你是搞逆向工程或者程序分析的,那你应该知道IDA Pro这款工具有多牛逼。不管是静态分析还是动态分析,IDA Pro都能给你提供最强大的支持,尤其是动态分析,它能够实时监控程序的执行,帮助你发现程序在运行时的一些潜在问题或者漏洞。对于很多刚接触IDA Pro的朋友,可能会有点困惑,像IDA Pro怎么做动态分析 如何实时监控IDA Pro的程序执行,别急,今天就带你们一起来看看,这些操作其实没那么复杂,跟着我走就行。...
阅读全文 >
 汽车安全
汽车安全  金融保险
金融保险  游戏开发
游戏开发  网络安全与防护
  工业4.0应用升级产业
  渗透测试
渗透测试  教育
教育  知识产权
知识产权 司法鉴定
司法鉴定 