

行业解决方案
查看所有行业解决方案
IDA 用于解决软件行业的关键问题。
发布时间:2023-05-26 17: 32: 54
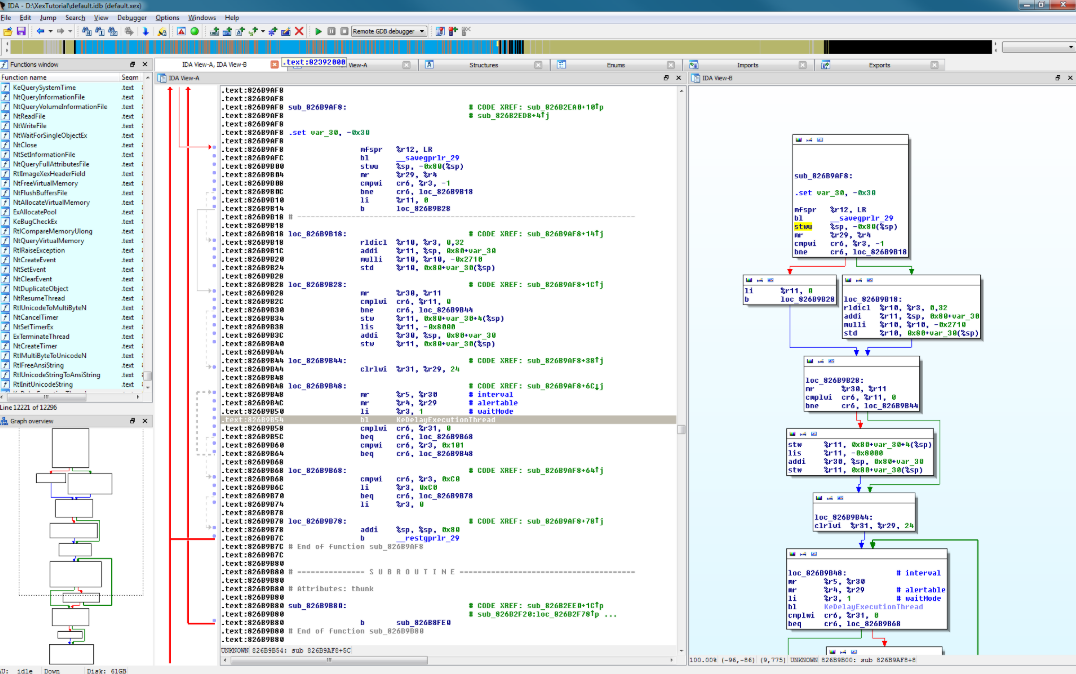
Action name:SetupDebugger
This dialog box allows to specify different settings related to the debugger.
Events
-Suspend on debugging start
If selected,the debugger will suspend directly once the debugging
starts.
-Evaluate event condition on exit
If selected,the debugger will evaluate the event condition immediately
before closing the debugging session(once we receive PROCESS_EXITED or
PROCESS_DETACHED event)
-Suspend on process entry point
If selected,the debugger will insert a temporary breakpoint
at the main entry point of the debugged application.
-Suspend on thread start/exit
If selected,the debugger will suspend if a new thread starts
or if an existing thread terminates.
-Suspend on library load/unload
If selected,the debugger will suspend if a new library is
loaded or if a previously loaded library is unloaded.
-Suspend on debugging message
If selected,the debugger will suspend if the debugged application
generates a message destined to the debugger.
Event condition
When one or more debug events(see above)are checked then this
option is used to specify a condition.In the following example,
the debugger will suspend the prcoess whenever a module with the
name test.dll is loaded:
get_event_id()==LIB_LOADED&&strstr(get_event_module_name(),"test.dll")!=-1
Log
-Segment modifications
If selected,the debugger will print information regarding
segment modifications(creation,deletion,or resizing of
segments)since the last event.Note that the debugger
doesn't continuously track segment modifications,but detects
those only if a debugging event occurs.
-Thread start/exit
If selected,the debugger will print a message if a new thread
starts or if an existing thread terminates.
-Library load/unload
if Selected,the debugger will print a message if a new library is
loaded or if a previously loaded library is unloaded.
-Breakpoint
If selected,the debugger will print a message if the debugged process
reaches a breakpoint.
-Debugging message
If selected,the debugger will print debugging messages from
the application.
Options
-Reconstruct the stack
If selected,the debugger will try to reconstruct the chain of stack
frames,based on information available on the stack and in the
function stack variables.
-Show debugger breakpoint instructions
If selected,the debugger will show breakpoint instructions inserted
by the debugger itself.This function is mainly useful if the user
wants to see the real content of the memory.
-Use hardware temporary breakpoints
If selected,IDA will try to use hardware breakpoints for the temporary
breakpoints used to implement the"step over"and"run to"functionality.
This feature is useful when debugging read-only or self-modifying code,
since it does not change the contents of the memory.
IDA will fall back to software breakpoints if the attempt to set a
hardware breakpoint fails.
-Autoload PDB files
If selected,IDA will invoke the PDB plugin to try to load PDB symbols
for every new module loaded into process.
-Set as just-in-time debugger
If changed from off to on,IDA will try to register itself as a
just-in-time debugger(invoked by the system in case of application
crashes)on dialog close.
Edit exceptions
This button allows the user to setup
how the debugger will react to specific exceptions.
Reload exceptions
This button reloads the exception table from the exceptions.cfg
file.
以下为中文翻译:
操作名称:SetupDebugger
此对话框允许指定与调试器相关的不同设置。
事件
-在调试开始时挂起
如果选中,调试器将在调试完成后直接挂起
开始。
-评估退出时的事件条件
立即评估事件条件
在关闭调试会话之前(一旦我们收到PROCESS_EXITED或
PROCESS_DETACHED事件)
-挂起进程入口点
如果选中,调试器将插入一个临时断点
在调试应用程序的主入口点。
-在线程启动/退出时挂起
如果选中,调试器将在新线程启动时挂起
或者如果现有线程终止。
-暂停库加载/卸载
如果选中,调试器将在新库出现时暂停
已加载或卸载了先前加载的库。
-暂停调试消息
如果选中,调试器将在被调试的应用程序停止时挂起
生成发往调试器的消息。
事件条件
当检查一个或多个调试事件(见上文)时,则此
选项用于指定条件。在下面的例子中,
每当模块与
名称test.dll已加载:
get_event_id()==LIB_LOADED&&strstr(get_event_module_name(),test.dll)!=-1
日志
-段修改
如果选中,调试器将打印有关的信息
段修改(创建、删除或调整大小
段)自上次活动以来。请注意,调试器
不会连续跟踪片段修改,但会检测
仅当调试事件发生时。
-线程启动/退出
如果选中,调试器将在新线程出现时打印一条消息
启动或现有线程终止。
-库加载/卸载
如果选择了,调试器将在新库被选中时打印一条消息
已加载或卸载了先前加载的库。
-断点
如果选中,调试器将打印一条消息,如果被调试的进程
到达一个断点。
-调试消息
如果选中,调试器将从中打印调试消息
应用程序。
选项
-重建堆栈
堆栈链
帧,基于堆栈和中可用的信息
函数堆栈变量。
-显示调试器断点指令
如果选中,调试器将显示插入的断点指令
由调试器本身。这个功能主要是有用的,如果用户
想看看内存的真实内容。
-使用硬件临时断点
如果选中,IDA将尝试使用硬件断点进行临时
用于实现跨步和运行功能的断点。
此功能在调试只读或自修改代码时很有用,
因为它不会改变内存的内容。
如果尝试设置一个
硬件断点失败。
-自动加载PDB文件
如果选中,IDA将调用PDB插件来尝试加载PDB符号
对于加载到进程中的每个新模块。
-设置为即时调试器
如果从关闭更改为打开,IDA将尝试将自己注册为
即时调试器(在应用程序的情况下由系统调用
崩溃)对话框关闭。
编辑例外
此按钮允许用户设置
调试器将如何对特定异常做出反应。
重新加载异常
exceptions.cfg重新加载异常表文件。
展开阅读全文
︾
专业销售为您服务

读者也喜欢这些内容:
IDA Pro中文设置在哪里切换 IDA Pro中文设置后界面仍是英文怎么办
不少人想把IDA Pro改成中文界面,通常是因为长期做审计和逆向,菜单、提示、日志看得多,想降低认知负担。但这里要先把概念说清楚,IDA Pro对中文的支持更多体现在字符与编码层面,比如注释、字符串、符号名能否正确显示,而不是整套界面是否提供官方中文本地化。...
阅读全文 >
IDA Pro调试过程中查看基址 IDA Pro调试多线程的解决方法
在逆向分析和漏洞挖掘的过程中,IDA Pro作为业界广泛使用的静态与动态分析工具,承担着极为关键的角色。尤其在调试环境中,程序基址的准确获取与线程调度的合理处理,将直接影响整个分析流程的准确性与效率。对于初中级用户而言,“IDA Pro调试过程中查看基址”与“IDA Pro调试多线程的解决方法”常常是易出错、高频卡顿的问题节点。本文将围绕这两个核心环节,进行实操级别的详细解析,并进一步延伸说明IDA Pro如何借助Trace功能还原函数调用路径,以帮助使用者构建完整调试体系,提升静动态结合分析的深度和广度。...
阅读全文 >
IDA Pro如何调试脚本 IDA Pro脚本调试可以使用哪些工具
做逆向工程或者安全分析的小伙伴都知道IDA Pro这个软件,它还有个功能很实用,就是脚本调试。IDA Pro的脚本功能不仅能做更深入的分析,还能省下很多重复劳动时间,让逆向过程变得特别高效。接下来,我们就聊聊IDA Pro如何调试脚本 IDA Pro脚本调试可以使用哪些工具这个话题。...
阅读全文 >
IDA Pro怎么做动态分析 如何实时监控IDA Pro的程序执行
嘿!如果你是搞逆向工程或者程序分析的,那你应该知道IDA Pro这款工具有多牛逼。不管是静态分析还是动态分析,IDA Pro都能给你提供最强大的支持,尤其是动态分析,它能够实时监控程序的执行,帮助你发现程序在运行时的一些潜在问题或者漏洞。对于很多刚接触IDA Pro的朋友,可能会有点困惑,像IDA Pro怎么做动态分析 如何实时监控IDA Pro的程序执行,别急,今天就带你们一起来看看,这些操作其实没那么复杂,跟着我走就行。...
阅读全文 >
 汽车安全
汽车安全  金融保险
金融保险  游戏开发
游戏开发  网络安全与防护
  工业4.0应用升级产业
  渗透测试
渗透测试  教育
教育  知识产权
知识产权 司法鉴定
司法鉴定 