

行业解决方案
查看所有行业解决方案
IDA 用于解决软件行业的关键问题。
发布时间:2023-05-26 17: 31: 23
Action name:SetupTracing
This dialog box allows you to specify different settings related to the tracing features.
Trace buffer size
This setting indicates how many tracing events can fit in the trace buffer.
If the debugger must insert a new event and the buffer is full,
the oldest tracing event will be removed.
However,if you specify a size of 0,the buffer size isn't limited.
Notice that,for example,in the case of an instructions trace,
all executed instructions could be logged,which would quickly fill
up the memory!
Trace file
If a filename is specified,all future traced events will be appended to it.
Trace directory
The directory were trace files for the current database will be saved.If not
specified,the IDB directory will be used.
Stop condition
This IDC expression will be evaluated before the execution
of each instruction.If the expression returns true,the debugger will
suspend the execution.Please note that you can use register names in
the condition.
Tracing
-Trace over debugger segments
If selected,the debugger will not go step by step in debugger segments
(segments not available in the database).
-Trace over library functions
If selected,the debugger will not go step by step in library functions.
Enabling these options will speed up the execution,as many instructions
(from debugger segments and/or library functions)will not be traced.
Disabling these options can quickly fill the Tracing window,as all
instructions in DLLs and system functions will be executed step by step.
Notice that both options influence the way instruction and function tracings
will work.
Internally,the debugger proceeds like this:
-memorize the return address associated with the last executed call
instruction in database segments(the previously saved one is overwriten).
-setup a temporary breakpoint on this address once the IP is in a debugger
segment or library function,disable step by step,and run the thread.
-reenable step by step once this temporary breakpoint is reached.
-Do not log already logged IP
If selected,already executed instructions will not be logged if
they are executed again.
-Skip loops
If selected,tracing will be temporarily disabled for some loops
constructs.
Highlight
-Highlight instructions in IDA views
If selected,recorded instructions will be displayed in IDA views(disassembly
views)with a different background color.
-Main color
The main background color for traced instructions.
-Diff color
The background color for the instructions recorded and being diffed against the
currently loaded trace.
Instruction tracing
-Log if same IP
If selected,the debugger will also log all register modifications occuring
during the execution of prefixed instructions like REP MOVSB,...
Function tracing
-Log return instructions
If selected,the debugger will also log function returns.
If disabled,only function calls are logged.
Basic block tracing
-Log basic block instructions
If selected,all instructions from the current basic block will be logged
and displayed in the'Tracing'window,instead of only the last instruction of
the basic block.
以下为中文翻译:
操作名称:SetupTracing
此对话框允许您指定与描摹功能相关的不同设置。
跟踪缓冲区大小
此设置指示跟踪缓冲区中可以容纳多少跟踪事件。
如果调试器必须插入一个新事件并且缓冲区已满,
最早的跟踪事件将被删除。
但是,如果指定大小为0,则缓冲区大小不受限制。
请注意,例如,在指令跟踪的情况下,
可以记录所有执行的指令,这将很快填满
上内存!
跟踪文件
如果指定了文件名,所有未来跟踪的事件都将附加到它。
跟踪目录
当前数据库的跟踪文件目录将被保存。如果不
指定,将使用IDB目录。
停止条件
执行前进行评估
每条指令。如果表达式返回真,调试器将
暂停执行。请注意,您可以在
条件。
追踪
-跟踪调试器段
段中逐步进行
(数据库中不可用的段)。
-跟踪库函数
如果选中,调试器将不会在库函数中逐步执行。
启用这些选项将加快执行速度,因为许多指令
(来自调试器段和/或库函数)不会被跟踪。
禁用这些选项可以快速填满Tracing窗口,因为所有
DLL和系统函数中的指令将逐步执行。
跟踪的方式
将工作。
在内部,调试器是这样进行的:
-记住与最后执行的调用关联的返回地址
数据库段中的指令(先前保存的指令被覆盖)。
-一旦IP在调试器中,就在此地址上设置一个临时断点
段或库函数,逐步禁用,运行线程。
-到达临时断点后逐步重新启用。
-不要记录已经记录的IP
如果选择,已经执行的指令将不会被记录,如果
他们再次被处决。
-跳过循环
如果选中,将暂时禁用某些循环的跟踪
结构体。
强调
-在IDA视图中突出显示指令
如果选中,录制的指令将显示在IDA视图中(反汇编
视图)具有不同的背景颜色。
-主色
跟踪指令的主要背景色。
-差异颜色
记录的指令的背景颜色并与
当前加载的跟踪。
指令追踪
-如果IP相同则记录
如果选中,调试器还将记录所有发生的寄存器修改
在执行诸如REP MOVSB之类的前缀指令期间,...
函数追踪
-日志返回说明
如果选中,调试器还将记录函数返回。
如果禁用,则仅记录函数调用。
基本块跟踪
-记录基本块指令
记录当前基本块中的所有指令
并显示在“跟踪”窗口中,而不仅仅是最后一条指令
基本块。
展开阅读全文
︾
专业销售为您服务

读者也喜欢这些内容:
IDA调试MBR切换到16位模式 IDA调试Apk修改寄存器v0
在逆向分析中,MBR和APK分别代表底层引导机制与上层移动应用的典型研究对象。前者常涉及16位实模式与汇编流程控制的深入理解,后者则要求熟练掌握Smali代码、寄存器模拟与调试器调用。IDA pro作为广泛应用的逆向工具,不仅支持对MBR类二进制的低位调试,也能在APK分析中发挥符号识别与寄存器控制优势。本文将围绕IDA调试MBR切换到16位模式和IDA调试Apk修改寄存器v0两个核心主题展开操作细节讲解。...
阅读全文 >
IDA Pro调试过程中查看基址 IDA Pro调试多线程的解决方法
在逆向分析和漏洞挖掘的过程中,IDA Pro作为业界广泛使用的静态与动态分析工具,承担着极为关键的角色。尤其在调试环境中,程序基址的准确获取与线程调度的合理处理,将直接影响整个分析流程的准确性与效率。对于初中级用户而言,“IDA Pro调试过程中查看基址”与“IDA Pro调试多线程的解决方法”常常是易出错、高频卡顿的问题节点。本文将围绕这两个核心环节,进行实操级别的详细解析,并进一步延伸说明IDA Pro如何借助Trace功能还原函数调用路径,以帮助使用者构建完整调试体系,提升静动态结合分析的深度和广度。...
阅读全文 >
IDA Pro怎么分析虚拟机代码 IDA Pro虚拟机逆向工程
虚拟机(VM)加密与保护技术在现代软件保护中被广泛应用,它通过将原始指令转换为自定义的“虚拟指令”并在运行时由虚拟解释器执行,从而有效防止逆向分析。这种方法不仅提高了解析门槛,还极大增加了逆向工程的复杂度。面对这种高级保护手段,IDAPro怎么分析虚拟机代码,IDAPro虚拟机逆向工程成为很多逆向人员关注的重点话题。本文将围绕该问题展开,从识别虚拟机存在、分析VM架构、拆解虚拟指令到利用IDA工具进行自动化分析,提供一套系统化的解决路径。...
阅读全文 >
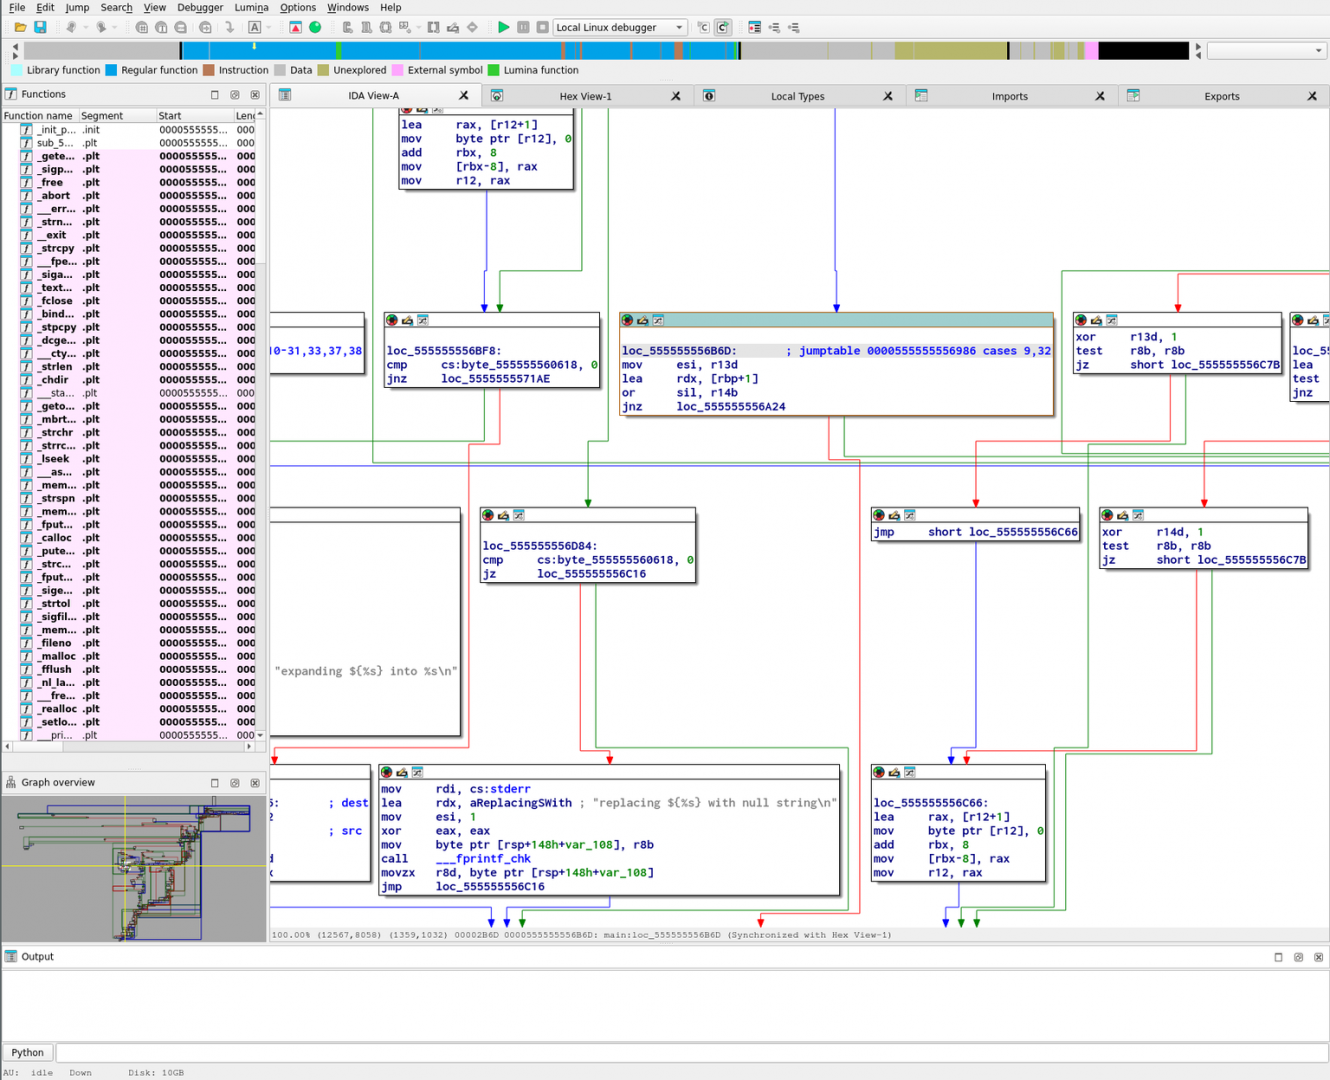
IDA Pro如何将程序的分支和循环结构可视化 IDA Pro如何生成控制流图
当你在进行程序分析和逆向工程时,有没有遇到过这些问题:程序结构复杂,分支多,循环多,看得眼花缭乱,根本搞不清楚执行流程?IDA Pro能帮你轻松搞定这些问题,还能将程序的分支、循环和控制流图展示得一目了然。今天就来聊聊,IDA Pro如何将程序的分支和循环结构可视化,IDA Pro如何生成控制流图,以及IDA Pro怎么优化流程图,让你能更快速、准确地理解和分析代码。...
阅读全文 >
 汽车安全
汽车安全  金融保险
金融保险  游戏开发
游戏开发  网络安全与防护
  工业4.0应用升级产业
  渗透测试
渗透测试  教育
教育  知识产权
知识产权 司法鉴定
司法鉴定 