

行业解决方案
查看所有行业解决方案
IDA 用于解决软件行业的关键问题。
发布时间:2023-05-11 15: 08: 40
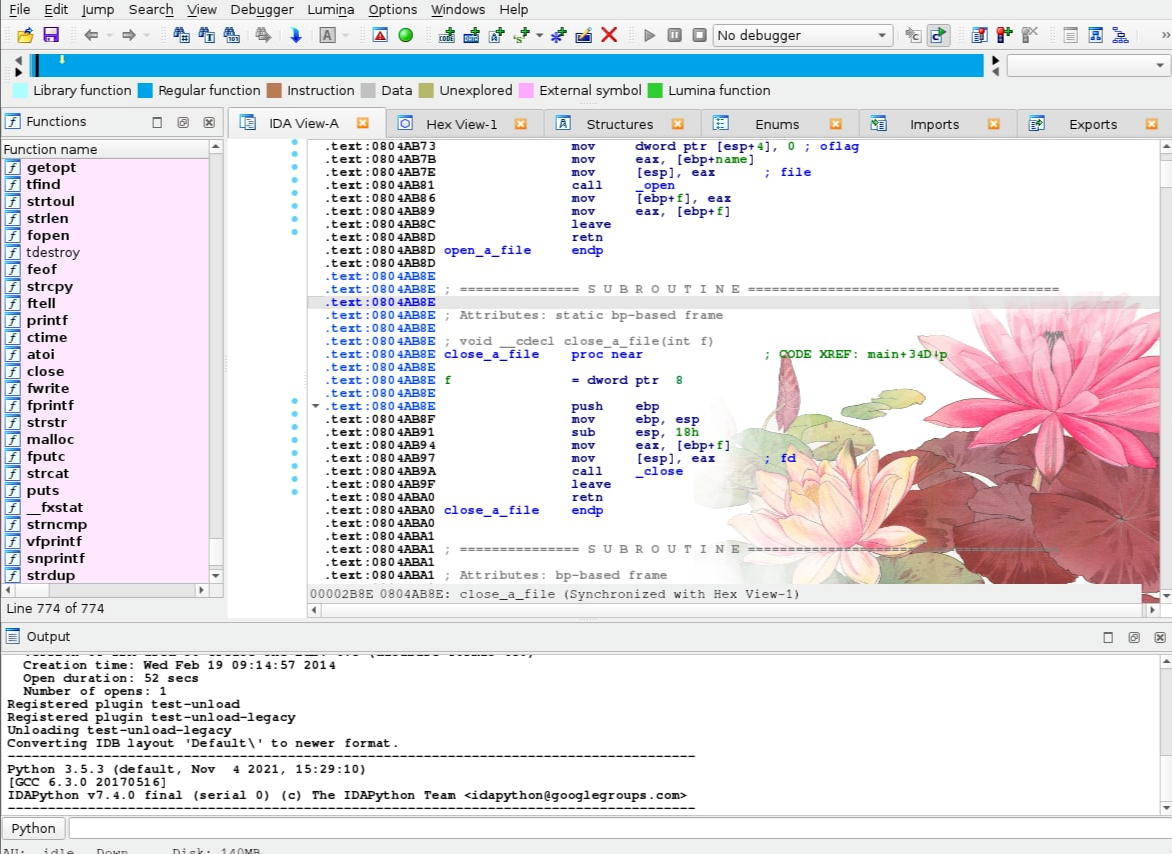
Action name:Debugger
Opens the debugger window.
In this window,you can view the register values for the selected thread.The debugger always selects the thread where the latest debugging event occurred.
For most registers,we have two different boxes:
-the first box(on the left)indicates the current value of the register.
Blue indicates that the value has changed since the last debugging event.
Purple indicates that the value has been modified by the user.
A popup menu is available on this control,offering different commands.
-the second box(on the right)shows the current value of the register,
interpreted like an address(if possible).
For a segment register,we only have one box indicating the current value.
For the flags register,we have one box indicating the current value,and small boxes indicating the status of the most important flags.
A popup menu is accessible everywhere in the window,which allows the user to show or hide different parts of the window:toolbar,thread list and available register classes.
See also Debugger submenu.
中文翻译:
操作名称:调试器
打开调试器窗口。
在此窗口中,您可以查看所选线程的寄存器值。调试器总是选择最近发生调试事件的线程。
对于大多数寄存器,我们有两个不同的框:
-第一个框(左侧)表示寄存器的当前值。
蓝色表示自上次调试事件以来该值已更改。
紫色表示该值已被用户修改。
此控件上有一个弹出菜单,提供不同的命令。
-第二个框(右侧)显示寄存器的当前值,解释为地址(如果可能)。
对于段寄存器,我们只有一个框表示当前值。
对于标志寄存器,我们有一个框表示当前值,以及指示最重要标志状态的小方框。
在窗口的任何地方都可以访问弹出菜单,它允许用户显示或隐藏窗口的不同部分:工具栏、线程列表和可用的寄存器类。
另请参阅调试器子菜单。
展开阅读全文
︾
专业销售为您服务

读者也喜欢这些内容:
IDA静态分析算法怎么理解 IDA静态分析算法在图视图里怎么验证判断
在IDA里说的静态分析算法,更多是指自动分析阶段对二进制做反汇编、函数识别、交叉引用与控制流建模的一整套推断流程。图视图把这种推断结果用基本块与边的形式直接展示出来,你不需要先把每条指令读完,就能先验证它的判断是否站得住,再决定哪里值得深挖。...
阅读全文 >
IDA Pro桌面布局怎么保存 IDA Pro桌面布局窗口不见了怎么找回
在日常逆向分析的客观场景里,你往往会把反汇编视图、函数窗口、字符串窗口等摆成顺手的布局,但换了数据库、切到调试或误操作关窗后,界面就会乱,甚至关键窗口直接消失。下面按最常用的菜单路径,把布局保存和窗口找回两件事写成可照做的步骤。...
阅读全文 >
IDA Pro如何批量分析文件 IDA Pro自动化脚本怎么写
说起逆向工程分析工具,不少人第一个想到的就是IDA Pro。只要掌握了IDA Pro自动化的一些小技巧,比如批量处理文件、用脚本自动分析,逆向工作的效率就会蹭蹭往上涨。这篇文章我就给大家聊聊IDA Pro如何批量分析文件 IDA Pro自动化脚本怎么写。...
阅读全文 >
ida怎么查看伪代码 ida伪代码能直接修改吗
IDA被广泛应用于反汇编和分析程序代码。不仅支持多种文件格式的分析,还可以生成伪代码。对于许多使用IDA的用户而言,了解“ida怎么查看伪代码 ida伪代码能直接修改吗”是一个重要内容。本文将着重介绍,帮助您掌握IDA在伪代码查看和修改方面的功能。...
阅读全文 >
 汽车安全
汽车安全  金融保险
金融保险  游戏开发
游戏开发  网络安全与防护
  工业4.0应用升级产业
  渗透测试
渗透测试  教育
教育  知识产权
知识产权 司法鉴定
司法鉴定 