

行业解决方案
查看所有行业解决方案
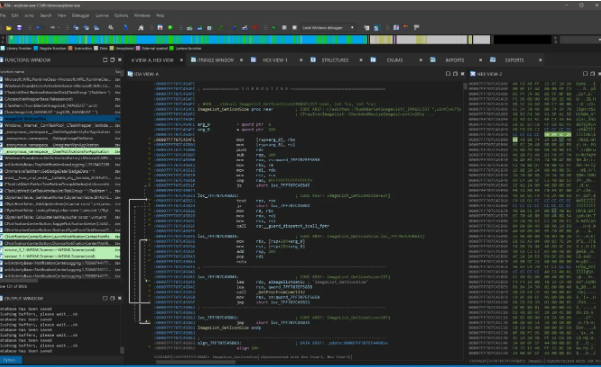
IDA 用于解决软件行业的关键问题。
发布时间:2023-05-26 17: 29: 53
Action name:StackTrace
Opens the stack trace window.
This window displays the function calls that brought the current instruction.
The top of the Stack Trace window lists the last function called by the program.Below this is the listing for the previously called functions.Each line indicates the name of the function which called the function represented by the previous line.
Double clicking on a line jumps to the exact address of the instruction realizing this call.
Currently,IDA uses the EBP frame pointer values to gather the stack trace information.It will fail for functions using other methods for the frame.
以下为中文翻译:
操作名称:StackTrace
打开堆栈跟踪窗口。
该窗口显示带来当前指令的函数调用。
Stack Trace窗口的顶部列出了程序调用的最后一个函数。
下面是之前调用的函数的列表。
表示函数的函数的名称
通过上一行。
双击一行跳转到指令实现的确切地址
这个电话。
目前,IDA使用EBP帧指针值来收集堆栈跟踪信息。
对于使用框架的其他方法的函数,它将失败。
展开阅读全文
︾
专业销售为您服务

读者也喜欢这些内容:
IDA Mac反编译怎么安装配置 IDA Mac反编译附加进程失败怎么排查
在Mac上用IDA,常见卡点通常不是打开文件,而是两步,一步是反编译能力没有真正装好或授权没识别到,另一步是本地附加进程时被macOS权限机制拦住。Hex-Rays官方安装文档、反编译说明和macOS调试教程其实把这两件事都讲得很清楚,按官方路径走,排障会快很多。...
阅读全文 >
ida反汇编成c语言的三个步骤 怎样将反汇编代码转换成c语言代码
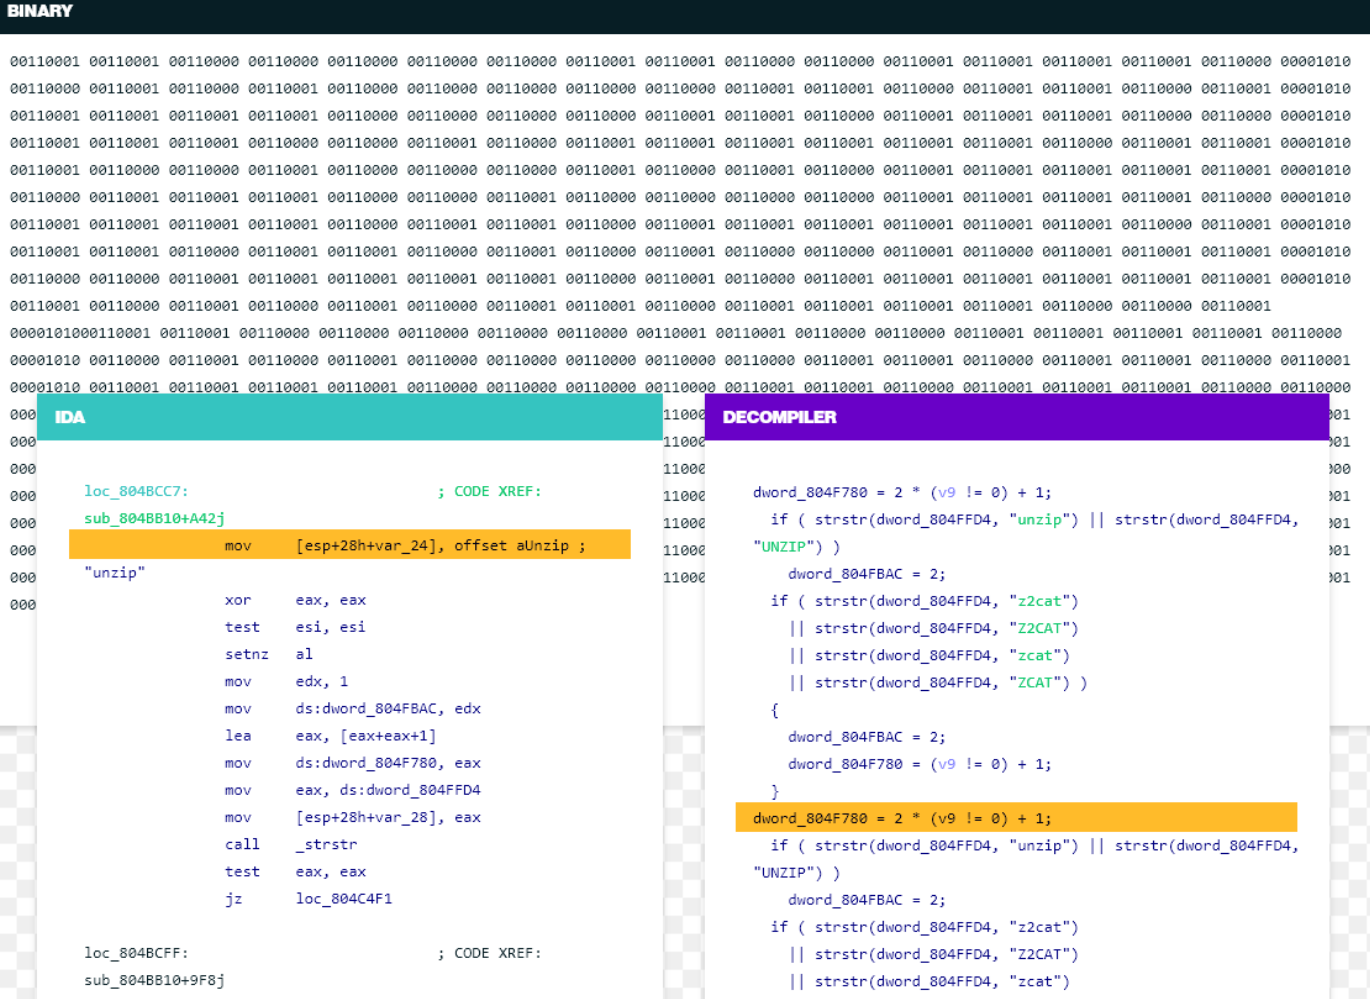
在逆向工程、安全分析以及老旧系统维护的实践中,如何借助IDA将汇编语言转化为C语言,是许多技术人员迫切关注的主题。IDA作为目前最成熟的反汇编工具之一,配合Hex-Rays Decompiler插件,可以将目标二进制程序自动生成接近C语言语义的伪代码,从而帮助开发者更快速理解程序逻辑、重构核心功能。本文围绕“ida反汇编成c语言的三个步骤,怎样将反汇编代码转换成c语言代码”这一主题,从实际操作出发,详细讲解整个转化过程。...
阅读全文 >
IDA Pro如何分析多架构代码 IDA Pro怎么做跨架构的反汇编
在复杂的嵌入式开发或固件逆向分析场景中,越来越多的系统采用多种处理器架构混合部署,例如主处理器采用ARM,而辅助模块可能采用MIPS、RISC-V甚至x86。针对这类多架构程序进行静态分析时,传统的反汇编工具显得力不从心。而IDA Pro作为一款功能强大的交互式反汇编工具,在支持多架构分析方面具备显著优势。本文围绕“IDA Pro如何分析多架构代码,IDA Pro怎么做跨架构的反汇编”为核心主题,详细说明操作流程与常见问题。...
阅读全文 >
如何优化IDA Pro的反汇编速度?如何设置IDA Pro加快程序分析过程?
IDA Pro大家应该都知道,是逆向工程师必备的工具。有时候,当程序越来越大、分析任务越来越复杂时,IDA Pro的反汇编速度就会有点慢。今天就来分享一些优化的小技巧:如何优化IDA Pro的反汇编速度?如何设置IDA Pro加快程序分析过程?帮你提升IDA Pro的速度,让程序分析更流畅。...
阅读全文 >
 汽车安全
汽车安全  金融保险
金融保险  游戏开发
游戏开发  网络安全与防护
  工业4.0应用升级产业
  渗透测试
渗透测试  教育
教育  知识产权
知识产权 司法鉴定
司法鉴定 