

行业解决方案
查看所有行业解决方案
IDA 用于解决软件行业的关键问题。
发布时间:2022-10-13 17: 05: 53
This small tutorial introduces the main functionalities of the IDA Debugger plugin. IDA supports debugging of x86 Windows PE files, AMD64 Windows PE files, and x86 Linux ELF files,either locally or remotely. Let's see how the debugger can be used to locally debug a simple buggy C console program compiled under Windows.
The buggy program.
This program simply computes averages of a set of values (1, 2, 3, 4 and 5). Those values are stored in two arrays: one containing 8 bit values, the other containing 32-bit values.
#include
char char_average(char array[], int count)
{
int i;
char average;
average = 0;
for (i = 0; i < count; i++)
average += array[i];
average /= count;
return average;
}
int int_average(int array[], int count)
{
int i, average;
average = 0;
for (i = 0; i < count; i++)
average += array[i];
average /= count;
return average;
}
void main(void) {
char chars[] = { 1, 2, 3, 4, 5 };
int integers[] = { 1, 2, 3, 4, 5 };
printf("chars[] - average = %d\n",
char_average(chars, sizeof(chars)));
printf("integers[] - average = %d\n",
int_average(integers, sizeof(integers)));
}
Running this program gives us the following results:
chars[] - average = 3
integers[] - average = 1054228
Obviously, the computed average on the integer array is wrong. Let's use IDA's debugger to understand the origin of this error !
Loading the file.
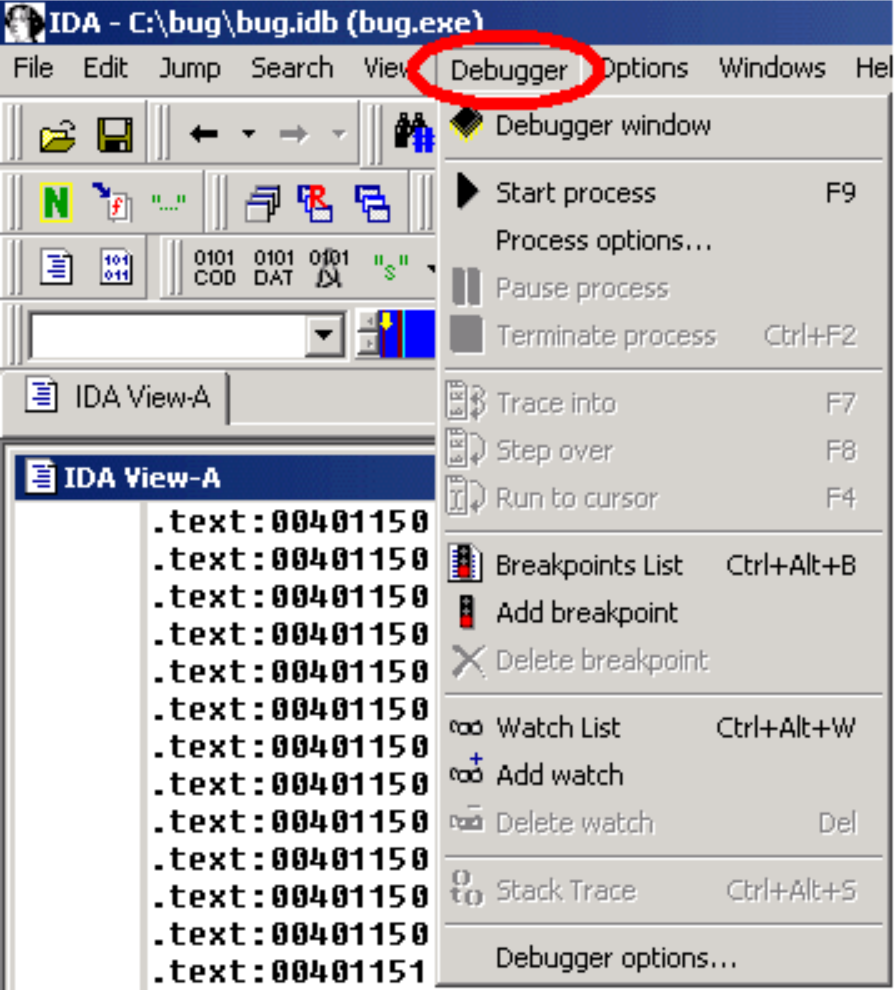
The debugger is perfectly integrated with IDA: to debug, we must first load the executable in IDA, to create a database. The user can disassemble the file interactively, and all the information which he will have added to the disassembly will be available during debugging. If the disassembled file is recognized as valid (x86/ARM64 PE or x86 ELF) by the debugger, a Debugger menu automatically appears in IDA's main window.
Instruction breakpoints.
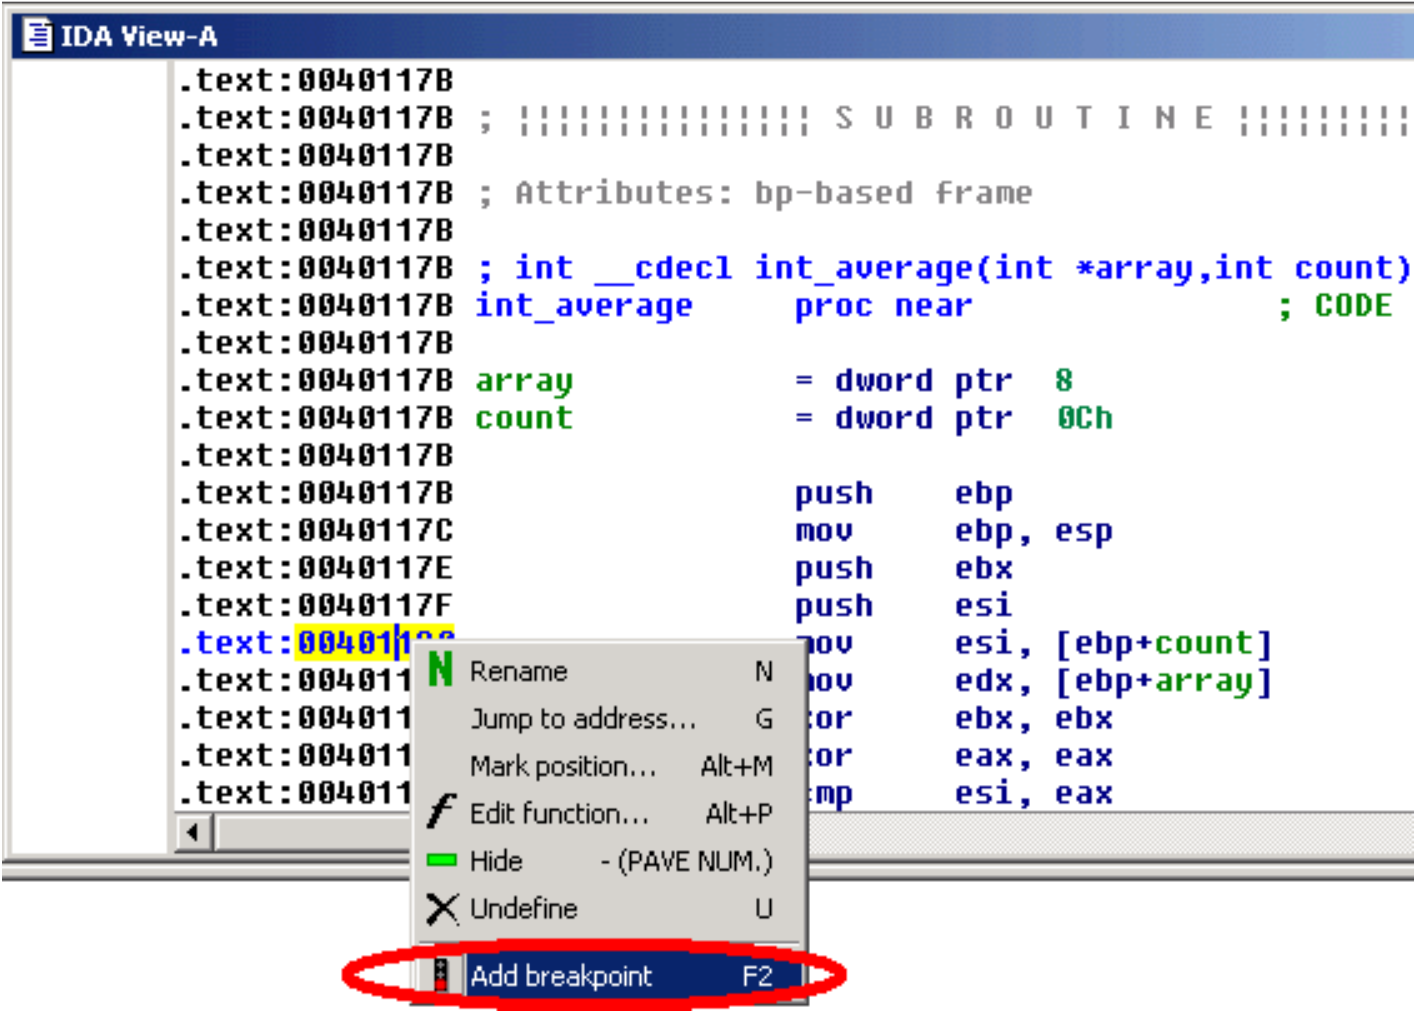
Once we located our int_average() function in the disassembly, let's add a breakpoint just after itsprolog, by selecting the Add breakpoint command in the popup menu, or by pressing the F2 key.
Program execution.
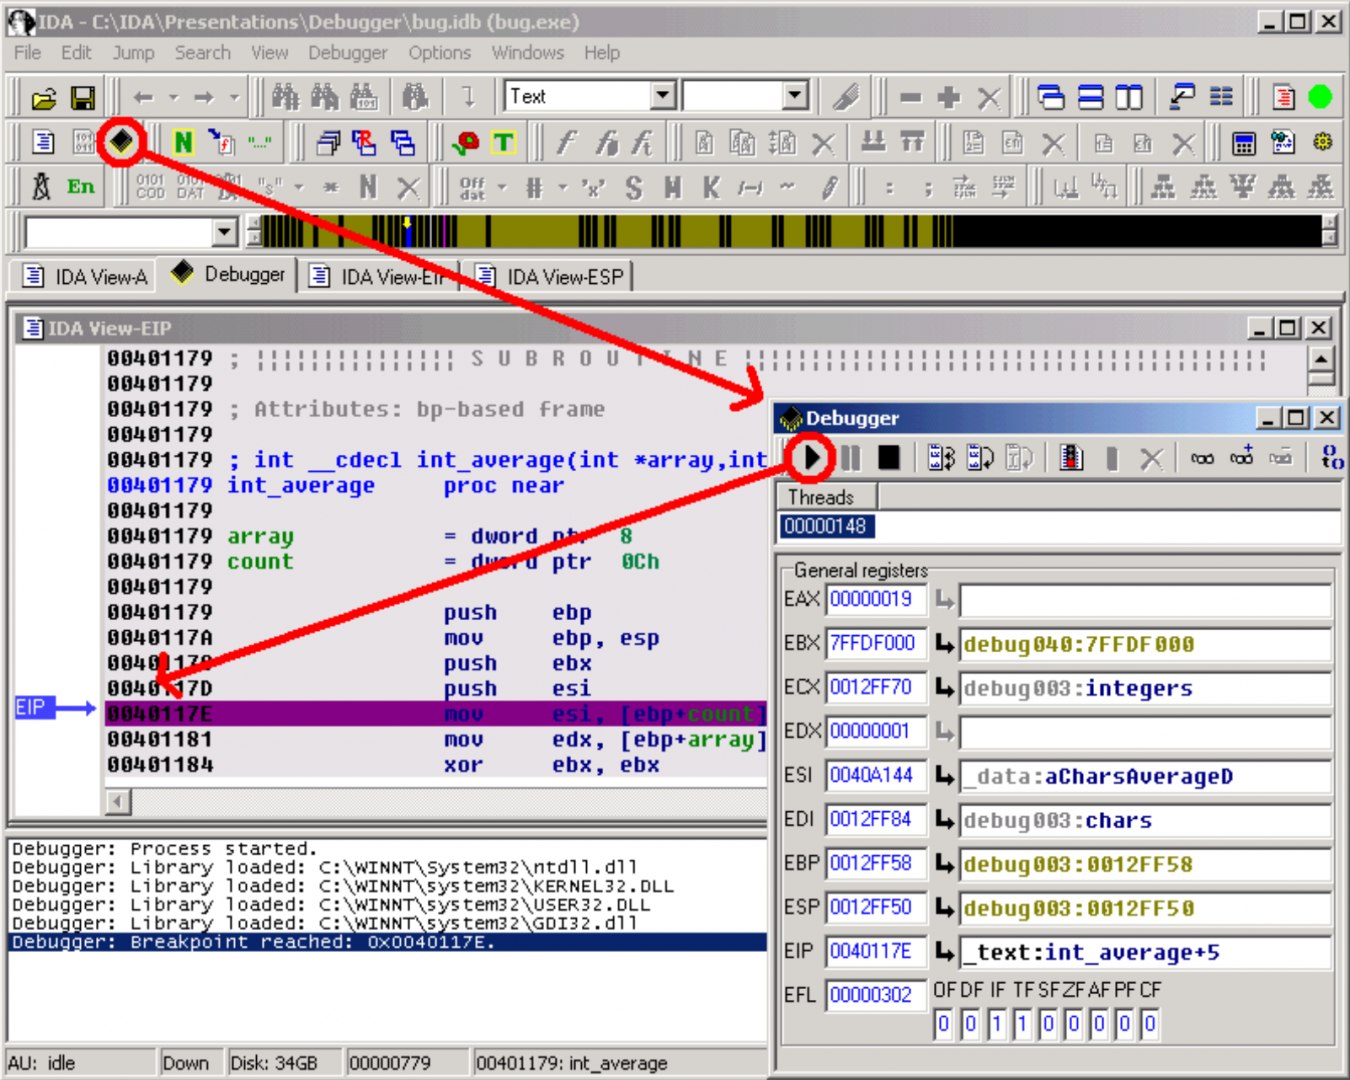
Now, we can start the execution. We simply open the debugger window by using the appropriateicon, and run the program until it reaches our breakpoint, by pressing the F9 key or clicking the Start button in the debugger toolbar.
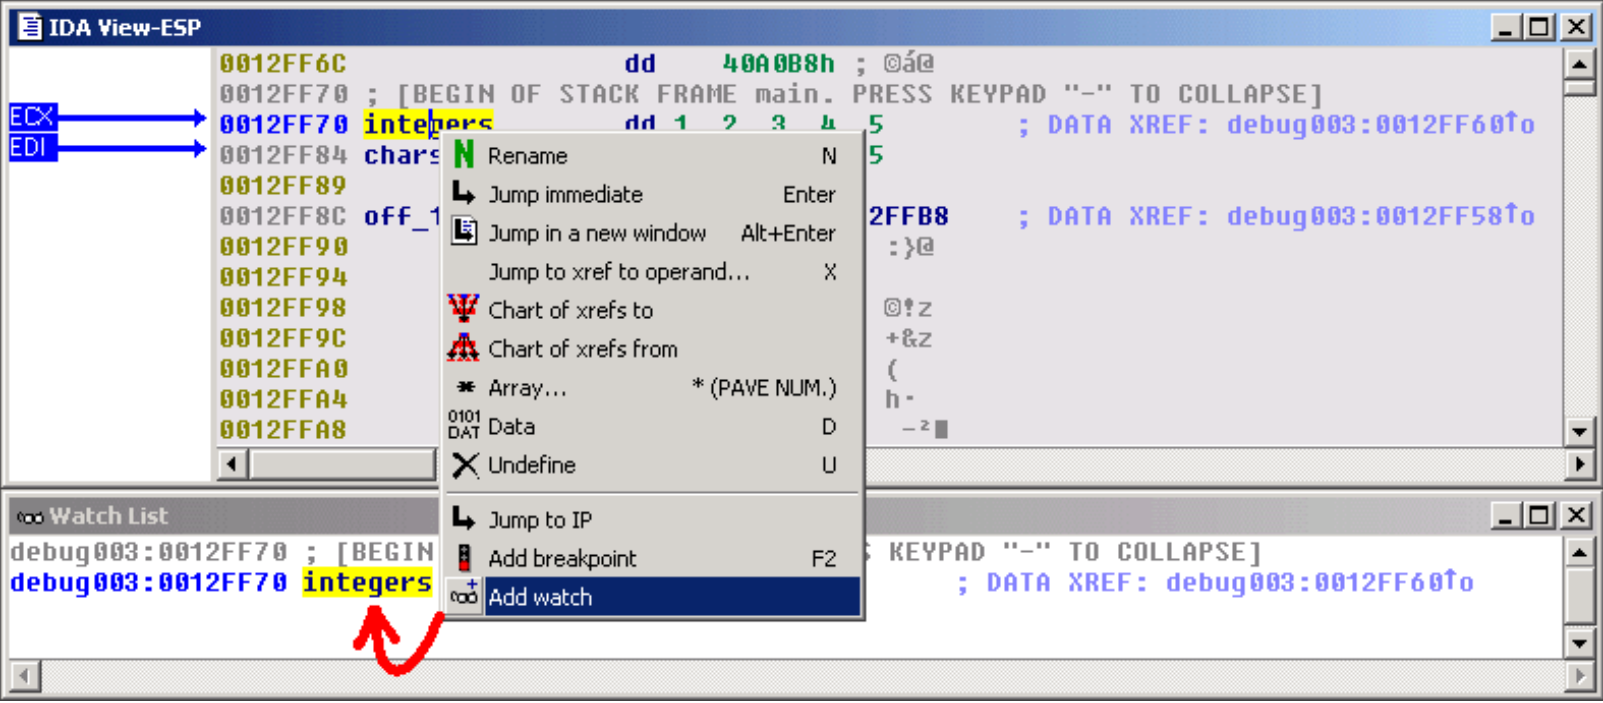
The stack.
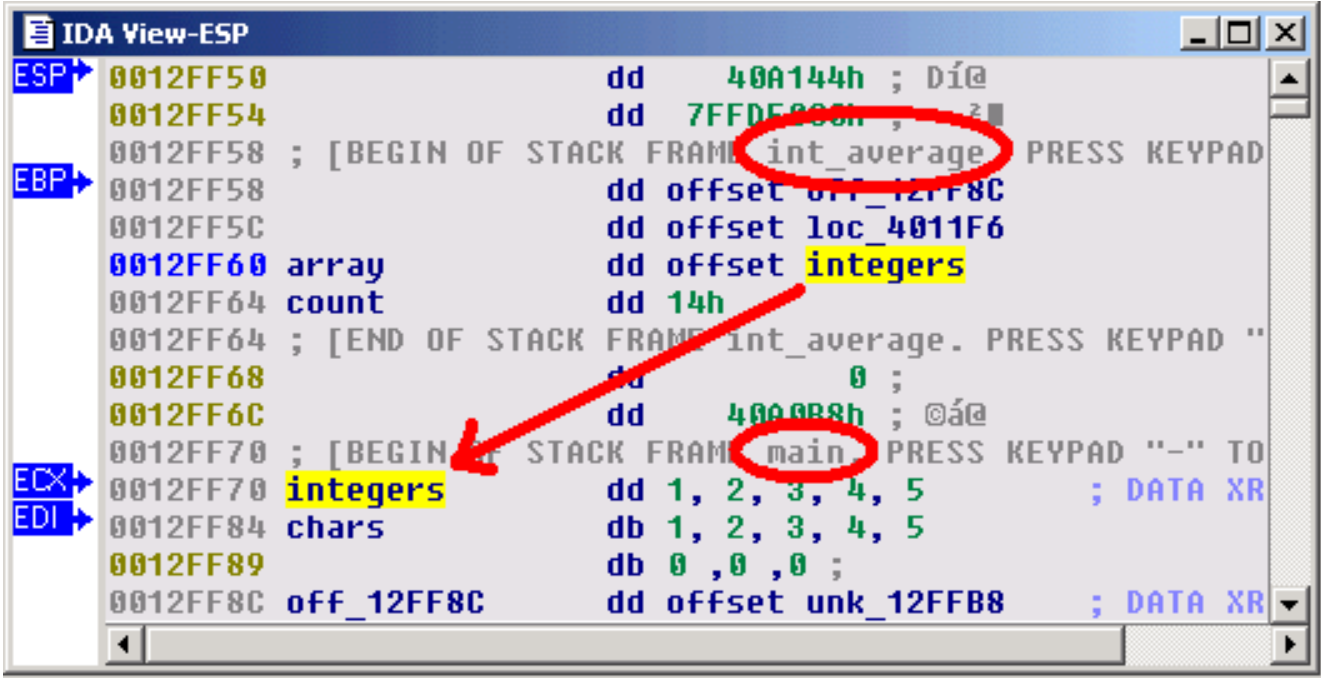
The IDA View-ESP window now shows us the stack frame of the interesting functions. We easily locate the array argument of our int_average() function, pointing to the integer array in the calling function (main() function).
Now, we can start the execution. We simply open the debugger window by using the appropriate icon, and run the program until it reaches our breakpoint, by pressing the F9 key or clicking the Start button in the debugger toolbar.
Watches.
Why not add a watch on this array, in order to observe the evolution of its values during the process execution ?
Address evaluation.
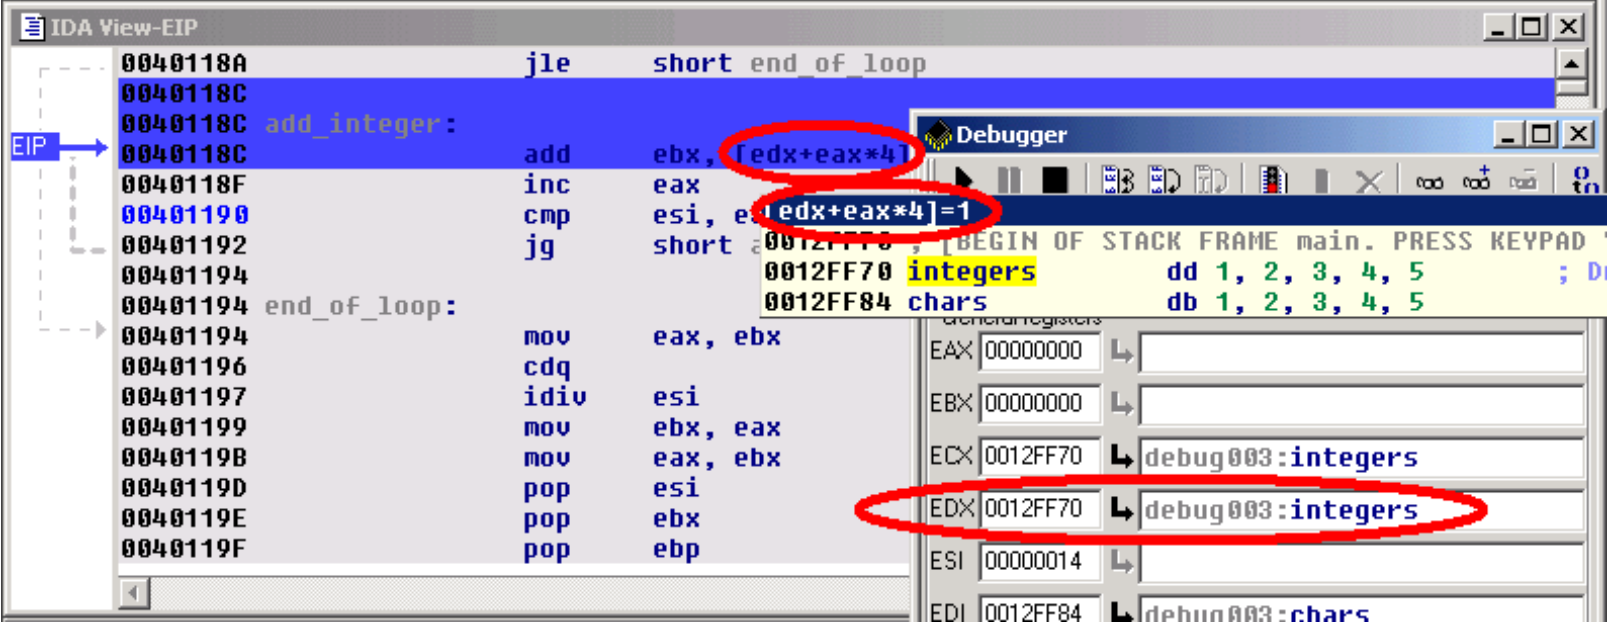
By analyzing the disassembled code, we can now locate the loop which computes the sum of the values, and stores the result in the EBX register. The [edx+eax*4] operand clearly shows us that the EDX register points to the start of the array, and that the EAX register is used as an index in this array. Thus, this operand will successively point to each integer from the integers array.
Step by step and jump targets.
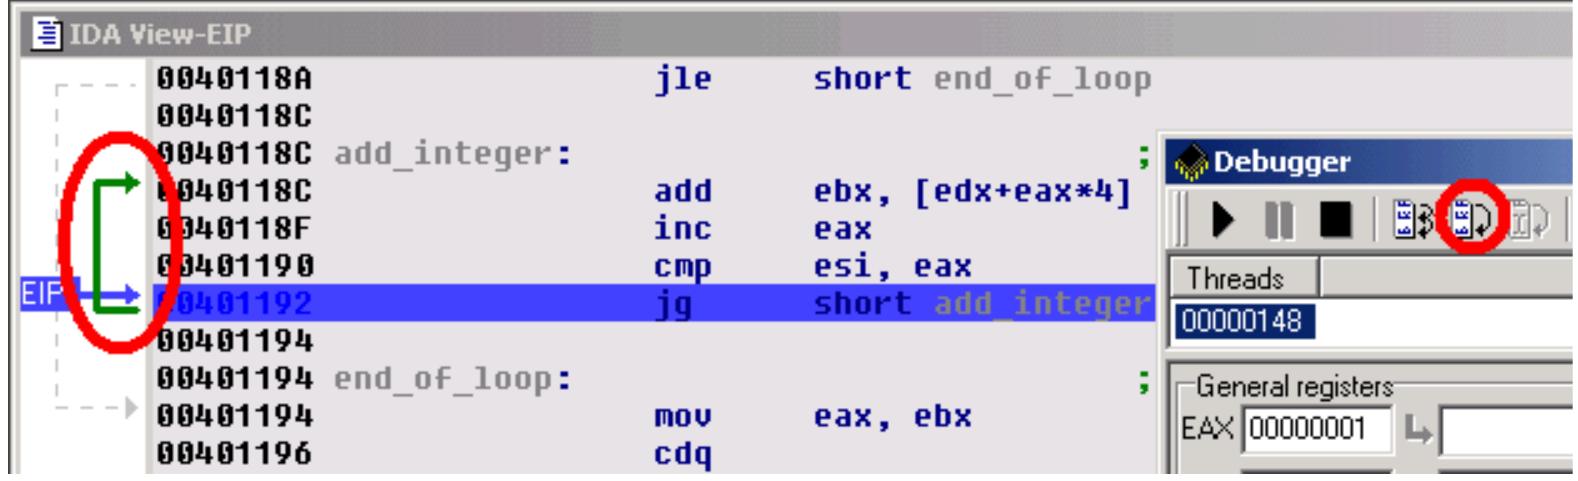
Let's advance step by step in the loop, by clicking on the adequate button in the debugger toolbar or by pressing the F8 key. If necessary, IDA draws a green arrow to show us the target of a jump instruction.
The bug uncovered.
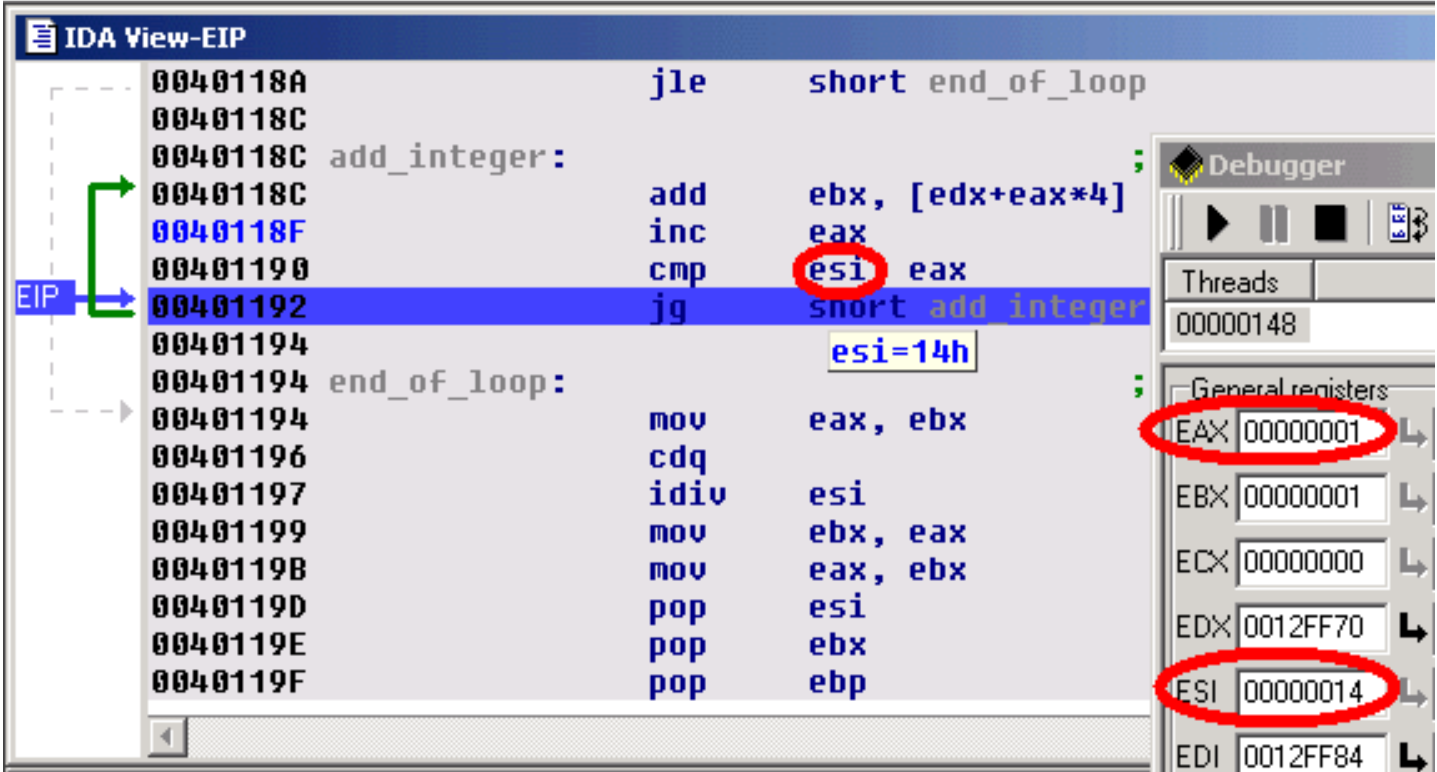
Now, let's have a look at ESI's value. The EAX register (our index in the array) is compared to this register at each iteration: so, we can conclude that the ESI register is used as a counter in the loop. But, we also observe that ESI contains a rather strange number of elements: 14h (= 20). Remember that our original array contains only 5 elements ! It seems we just found the source of our problem...
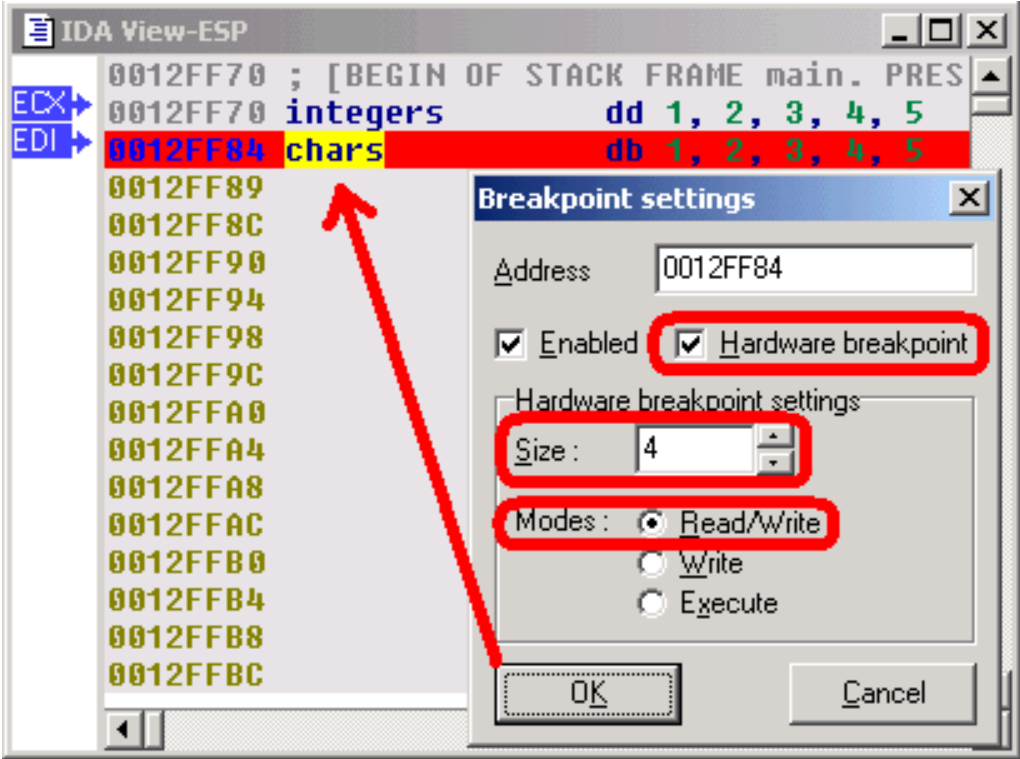
Hardware breakpoints.
To be sure, let's add a hardware breakpoint, just behind the last value of our integers array (in fact, on the first value of the chars array). If we reach this breakpoint during the loop, it will indeed prove that we read integers outside our array. So, we setup a hardware breakpoint with a size of 4 bytes (classical size for an integer) in Read mode.
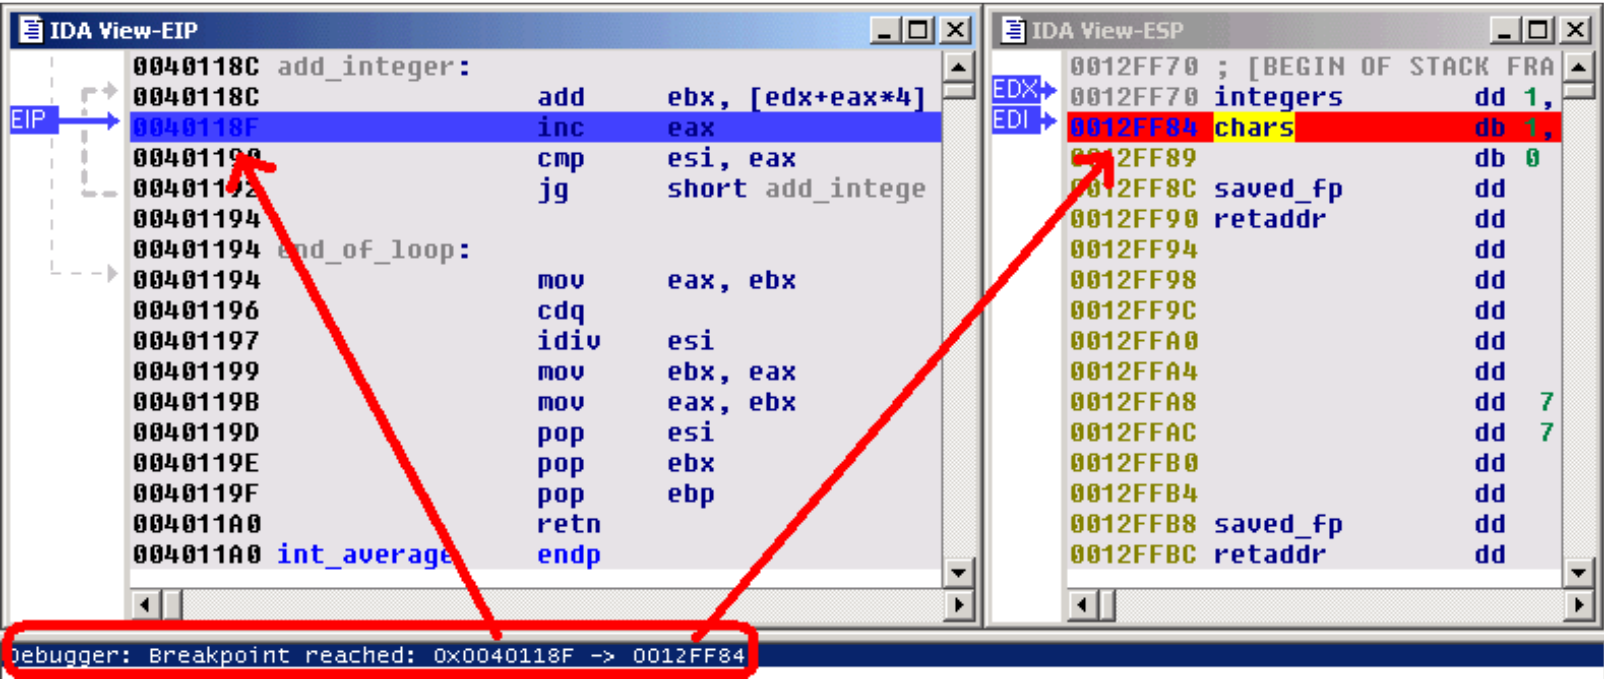
As foreseen, if we continue the execution, the hardware breakpoint indeed detects a read access to the first byte of the chars array. Remark that EIP points to the instruction following the one which caused the hardware breakpoint ! It is in fact rather logical: to cause the hardware breakpoint, the preceding instruction has been fully executed, so EIP now points to the next one.
Stack trace.
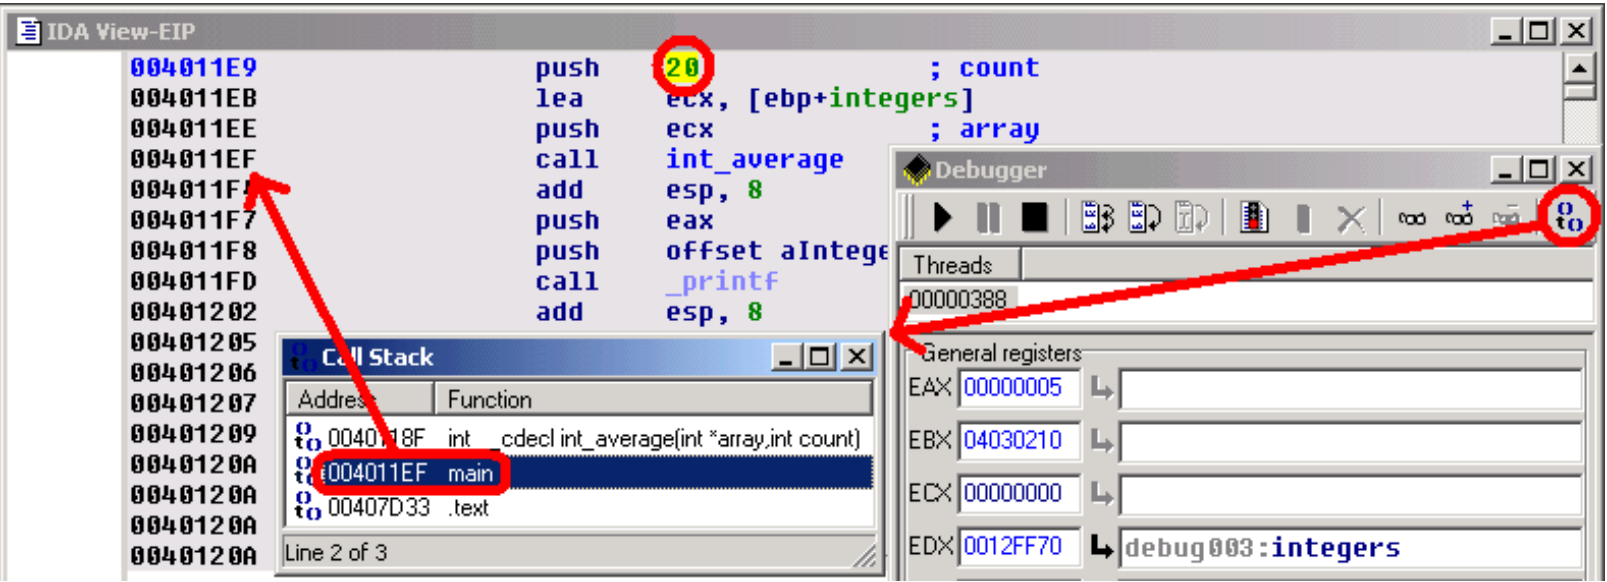
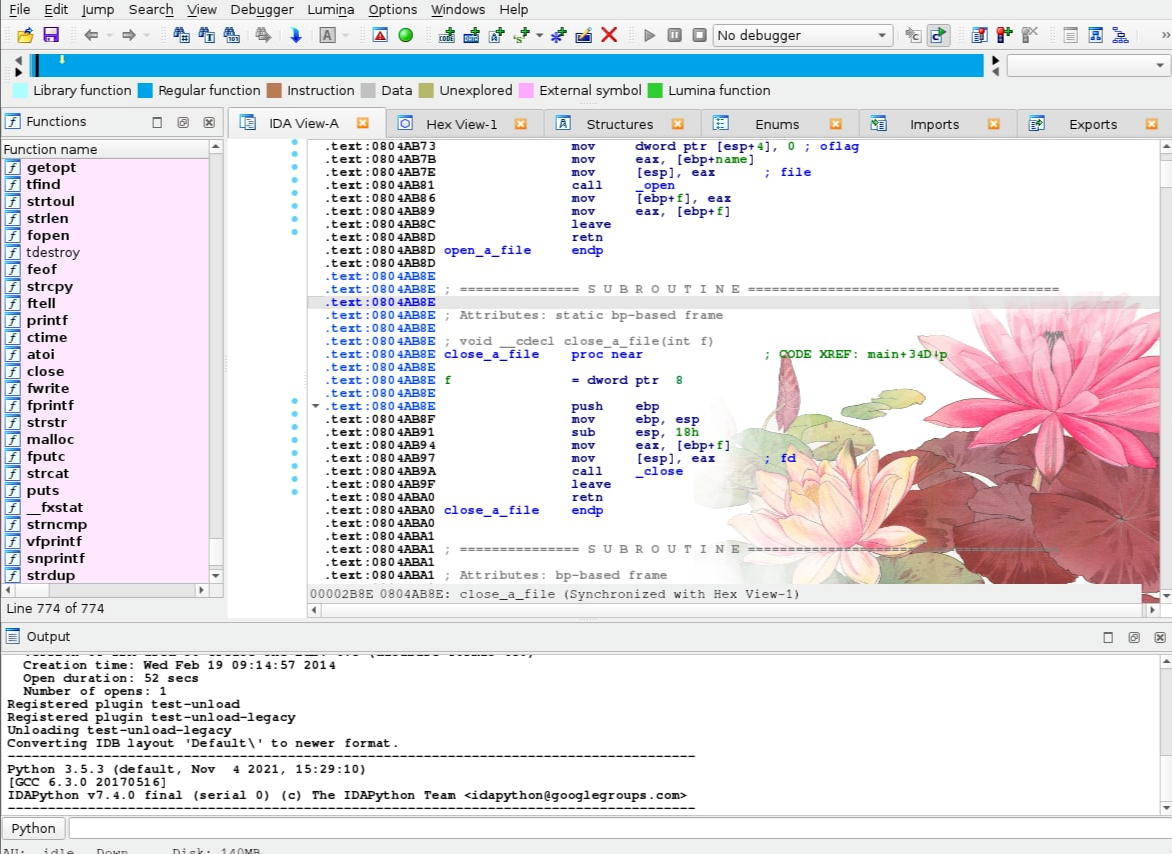
By looking at the disassembly, we see that the value stored in ESI comes from the count argument of our int_average() function. Let's try to understand why the caller gives us such a strange argument: If we open the Stack Trace window, we see a stack of all caller functions. Simply double click on the main() function, to jump to the caller code. With the help of IDA's PIT (Parameter Identification and Tracking) technology, we easily locate the push 20 instruction, passing an erroneous count value to our int_average() function.
Now, by looking closer at the C source code, we understand our error: we used the sizeof() operator,which returns the number of bytes in the array, rather than returning the number of items in this array ! As, for the chars array, the number of bytes was equal to the number of items, we didn't notice the error...
Other features.
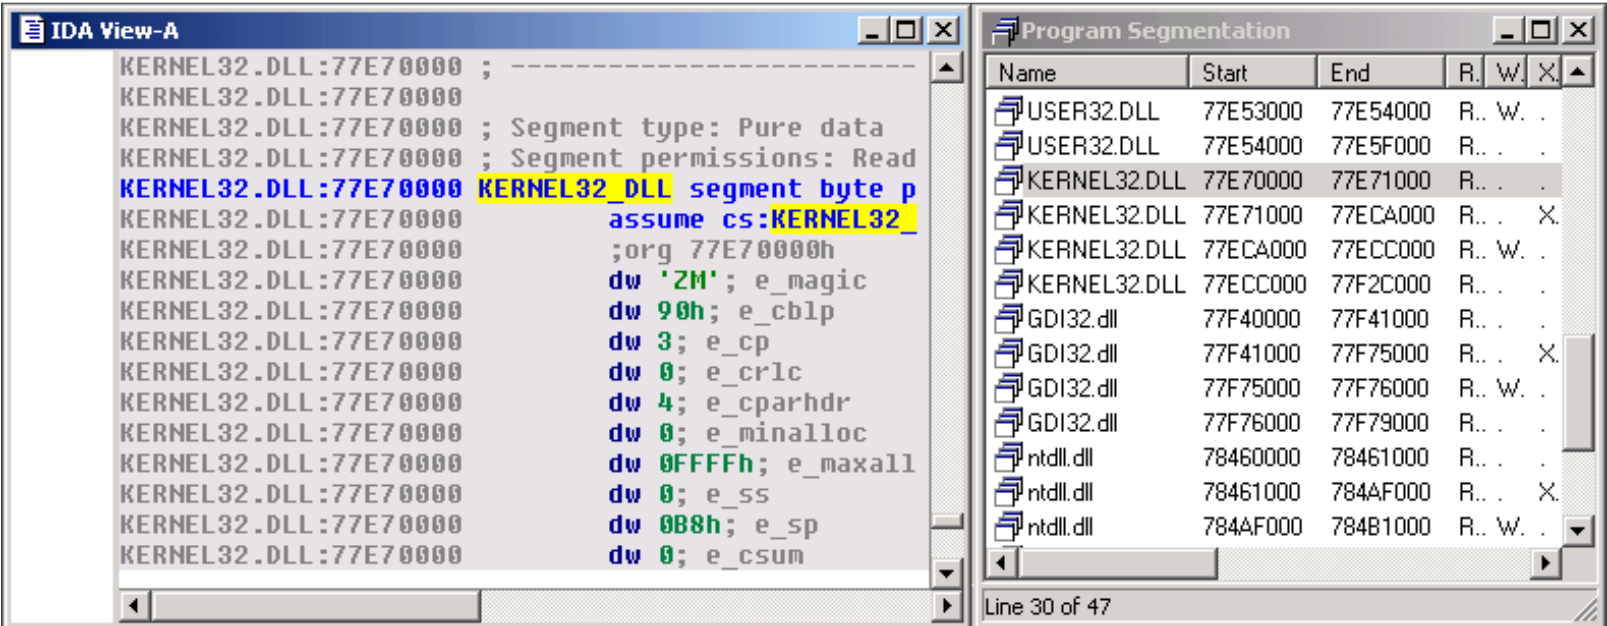
IDA's debugger gives you access to all the segments of a debugged process's memory space, allowing you to use all of IDA's powerful features: you can apply structures to bytes in memory, draw graphs, create breakpoints in DLLs, ...
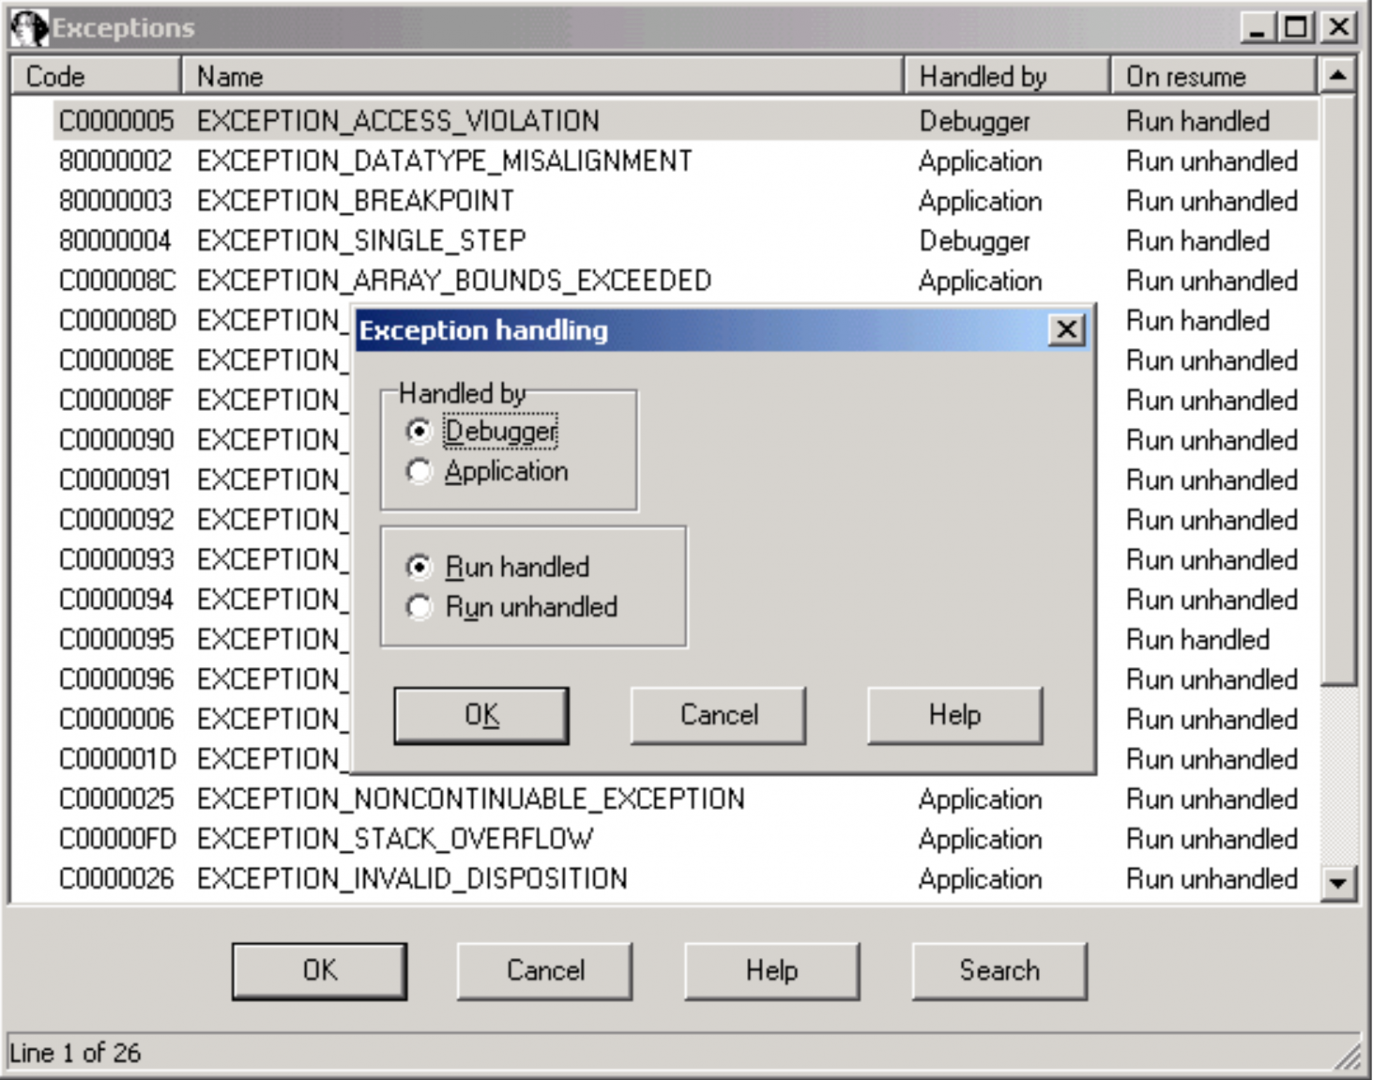
The way the debugger reacts to exceptions is fully configurable by the user.
This debugger is thus the essential complement to IDA itself, allowing you to interactively disassemble and debug everything, everywhere.
中文翻译:
这个小教程介绍了IDA调试器插件的主要功能。IDA支持调试x86 Windows PE文件,AMD64 Windows PE文件和x86 Linux ELF文件,可以在本地或远程调试。让我们看看如何使用调试器在Windows下本地调试一个简单的有缺陷的C控制台程序。
有缺陷的程序。
这个程序只是计算一组值(1、2、3、4和5)的平均值。这些值存储在两个数组中:一个包含8位值,另一个包含32位值。
#include
char char_average(char array[], int count)
{
int i;
char average;
average = 0;
for (i = 0; i < count; i++)
average += array[i];
average /= count;
return average;
}
int int_average(int array[], int count)
{
int i, average;
average = 0;
for (i = 0; i < count; i++)
average += array[i];
average /= count;
return average;
}
void main(void) {
char chars[] = { 1, 2, 3, 4, 5 };
int integers[] = { 1, 2, 3, 4, 5 };
printf("chars[] - average = %d\n",
char_average(chars, sizeof(chars)));
printf("integers[] - average = %d\n",
int_average(integers, sizeof(integers)));
}
运行这个程序,我们得到了以下结果:
chars[] - average = 3
integers[] - average = 1054228
Obviously, the computed average on the integer array is wrong. Let's use IDA's debugger to understand the origin of this error !
加载文件
调试器与IDA完美地集成在一起:为了进行调试,我们必须首先在IDA中加载可执行文件,以创建一个数据库。用户可以交互式地反汇编文件,所有添加到反汇编中的信息都将在调试期间可用。如果调试器将反汇编的文件识别为有效文件(x86 / ARM64 PE或x86 ELF),则Debugger菜单会自动出现在IDA的主窗口中。
指令断点
一旦我们在反汇编中定位了int_average()函数,让我们在它的Prolog之后添加一个断点,方法是选择弹出菜单中的添加断点命令,或按F2键。
程序执行
现在,我们可以开始执行。我们只需使用相应的图标打开调试器窗口,并通过按F9键或单击调试器工具栏中的“开始”按钮,运行程序直到达到我们的断点。
堆栈
IDA View-ESP窗口现在向我们显示了感兴趣的函数的堆栈帧。我们很容易找到我们的int_average()函数的数组参数,该参数指向调用函数(main()函数)中的整数数组。
现在,我们可以开始执行。我们只需使用相应的图标打开调试器窗口,并通过按F9键或单击调试器工具栏中的“开始”按钮,运行程序直到达到我们的断点。
观察点
为什么不在该数组上添加一个观察点,以便在进程执行期间观察其值的变化?
地址评估
通过分析反汇编代码,我们现在可以找到计算值的和并将结果存储在EBX寄存器中的循环。[edx + eax * 4]操作数清楚地向我们显示EDX寄存器指向数组的开始,并且EAX寄存器用作此数组中的索引。因此,此操作数将依次指向整数数组中的每个整数。
逐步执行和跳转目标。
让我们逐步在循环中前进,通过在调试器工具栏中单击适当的按钮或按F8键。如有必要,IDA会绘制一个绿色的箭头,以显示跳转指令的目标。
发现错误。
现在,让我们看一下ESI的值。EAX寄存器(数组中的索引)在每次迭代时与此寄存器进行比较:因此,我们可以得出结论,ESI寄存器在循环中用作计数器。但是,我们还观察到ESI包含相当奇怪的元素数量:14h(= 20)。请记住,我们原始的数组仅包含5个元素!似乎我们刚刚发现了问题的来源...
硬件断点
为了确保我们的推测,让我们在整数数组的最后一个值后面添加一个硬件断点(实际上是在字符数组的第一个值上)。如果在循环期间到达此断点,它确实会证明我们读取了数组之外的整数。因此,我们以“读”模式设置了一个大小为4字节(整数的经典大小)的硬件断点。
正如预料的那样,如果我们继续执行,硬件断点确实检测到了对字符数组的第一个字节的读取访问。请注意,EIP指向导致硬件断点的指令之后的指令!事实上,这是相当合理的:为了引起硬件断点,之前的指令已被完全执行,因此EIP现在指向下一个指令。
堆栈跟踪
通过查看反汇编,我们可以看到存储在ESI中的值来自我们的int_average()函数的count参数。让我们试着理解为什么调用者给了我们这样一个奇怪的参数:如果我们打开堆栈跟踪窗口,我们会看到所有调用者函数的堆栈。只需双击main()函数即可跳转到调用者代码。借助IDA的PIT(参数识别和跟踪)技术,我们很容易找到将一个错误的count值传递给我们的int_average()函数的push 20指令。
现在,通过仔细查看C源代码,我们了解了我们的错误:我们使用了sizeof()运算符,该运算符返回数组中的字节数,而不是返回该数组中的项数!因为对于字符数组,字节数等于项数,所以我们没有注意到错误......
其他功能
IDA的调试器可以访问调试过程的内存空间中的所有段,使您可以使用IDA的所有强大功能:您可以将结构应用于内存中的字节,绘制图形,为DLL创建断点......
调试器对异常的反应方式完全可由用户配置。
因此,这个调试器是IDA本身的必备补充,允许您交互式地反汇编和调试任何内容,任何地方。
展开阅读全文
︾
专业销售为您服务

读者也喜欢这些内容:
IDA pro修改so教程 IDA pro修改exe
在逆向分析与二进制安全研究中,IDA pro作为主流静态分析工具,其强大的反汇编与重构能力,广泛应用于ELF格式的so库与PE格式的exe文件修改。通过IDA pro修改so文件,可用于Android应用补丁、破解函数逻辑、绕过验证;而对exe文件的修改则常用于Windows下的补丁、功能改写与程序定制。掌握IDA pro修改so与exe的流程,不仅能提升分析效率,更是逆向工程技能的基础能力。以下内容将系统讲解IDA pro修改so教程,IDA pro修改exe两大操作场景的具体步骤,帮助用户完整掌握二进制修改流程。...
阅读全文 >
ida反汇编成c语言的三个步骤 怎样将反汇编代码转换成c语言代码
在逆向工程、安全分析以及老旧系统维护的实践中,如何借助IDA将汇编语言转化为C语言,是许多技术人员迫切关注的主题。IDA作为目前最成熟的反汇编工具之一,配合Hex-Rays Decompiler插件,可以将目标二进制程序自动生成接近C语言语义的伪代码,从而帮助开发者更快速理解程序逻辑、重构核心功能。本文围绕“ida反汇编成c语言的三个步骤,怎样将反汇编代码转换成c语言代码”这一主题,从实际操作出发,详细讲解整个转化过程。...
阅读全文 >
IDA动态调试的使用方法 IDA动态调试后自动更新变量名
在分析复杂程序时,仅靠静态反汇编往往无法看到完整的运行逻辑,尤其是加壳、动态调用、异或加密等场景。此时,借助IDA Pro的动态调试功能,可以实时捕捉程序执行流程,监控变量值和调用栈变化,大大提高分析准确性。更进一步,IDA Pro还支持调试过程中自动更新变量名和函数名,提高代码可读性。本文围绕“IDA动态调试的使用方法IDA动态调试后自动更新变量名”进行详解,帮助你从基础操作入手,深入掌握IDA的高级用法。...
阅读全文 >
IDA Pro如何批量分析文件 IDA Pro自动化脚本怎么写
说起逆向工程分析工具,不少人第一个想到的就是IDA Pro。只要掌握了IDA Pro自动化的一些小技巧,比如批量处理文件、用脚本自动分析,逆向工作的效率就会蹭蹭往上涨。这篇文章我就给大家聊聊IDA Pro如何批量分析文件 IDA Pro自动化脚本怎么写。...
阅读全文 >
 汽车安全
汽车安全  金融保险
金融保险  游戏开发
游戏开发  网络安全与防护
  工业4.0应用升级产业
  渗透测试
渗透测试  教育
教育  知识产权
知识产权 司法鉴定
司法鉴定 