

行业解决方案
查看所有行业解决方案
IDA 用于解决软件行业的关键问题。
发布时间:2023-05-24 16: 49: 36
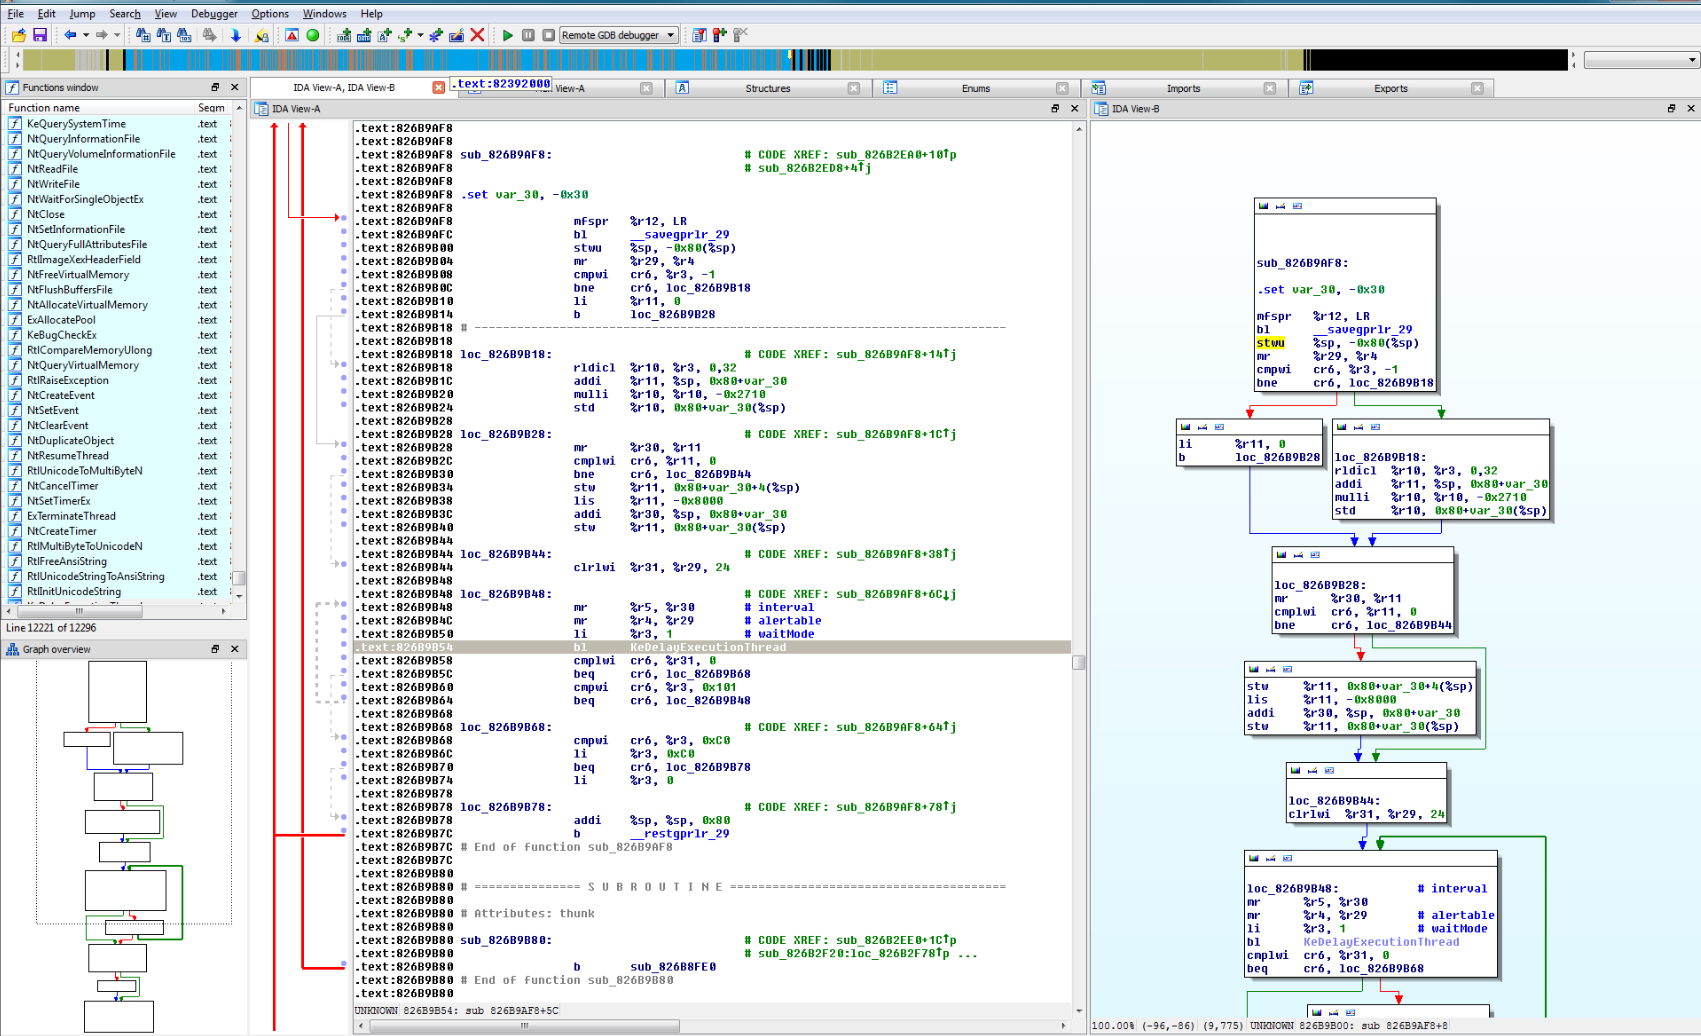
Action name:ToggleTraceFunctions
This command starts function tracing.You can then use all debugger commands as usual:the debugger will save all addresses where a call to a function or a return from a function occurred.
Internally,the debugger runs the current thread step by step to properly detect all function calls and returns.This explains why functions tracing is slower than a normal execution.
以下为中文翻译:
操作名称:ToggleTraceFunctions
此命令启动功能跟踪。
然后您可以像往常一样使用所有调试器命令:调试器将保存所有
函数调用或函数返回发生的地址。
步步运行当前线程
正确检测所有函数调用和返回。
这解释了为什么函数跟踪比正常执行慢。
展开阅读全文
︾
专业销售为您服务

读者也喜欢这些内容:
ida设置断点怎么运行 ida断点在键盘上的使用方法
在使用IDA pro进行逆向分析的过程中,断点设置是最基础也是最常用的调试手段之一。尤其是在处理复杂的汇编逻辑或定位关键执行点时,合理地设置并运行断点,能够极大提升分析效率与准确度。本文将围绕ida设置断点怎么运行,ida断点在键盘上的使用方法两个关键问题展开,详细介绍IDA pro中的断点操作方式、快捷键使用逻辑及其在多架构平台上的适配特性,帮助用户在实战中更加高效掌控IDA pro的调试能力。...
阅读全文 >
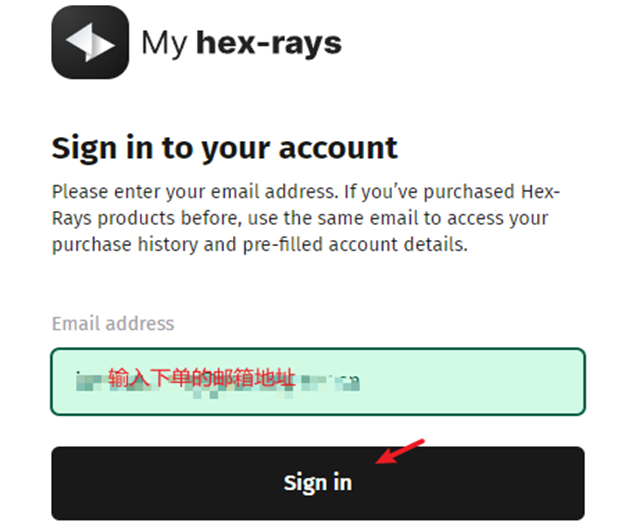
IDA Pro Portal 许可和程序下载安装指南
Hex-rays IDA 现采用全新的Portal帐户中心交付方式,用户购买后登录Hex-rays Portal 获取许可和程序,不再邮件发送许可文件和程序。...
阅读全文 >
IDA Pro的扩展功能如何使用 IDA Pro脚本有哪些高级用法
作为全球最受欢迎的反汇编与逆向分析工具之一,IDA Pro(Interactive Disassembler Professional) 不仅提供强大的静态分析能力,更具备灵活的扩展机制与脚本系统。借助这些功能,逆向工程师可以深入分析大型程序,自动化重复流程,乃至构建定制化的逆向框架。本文将围绕“IDA Pro的扩展功能如何使用”以及“IDA Pro脚本有哪些高级用法”两个主题进行全面剖析,帮助你掌握其进阶操作技巧,显著提升逆向分析效率与深度。...
阅读全文 >
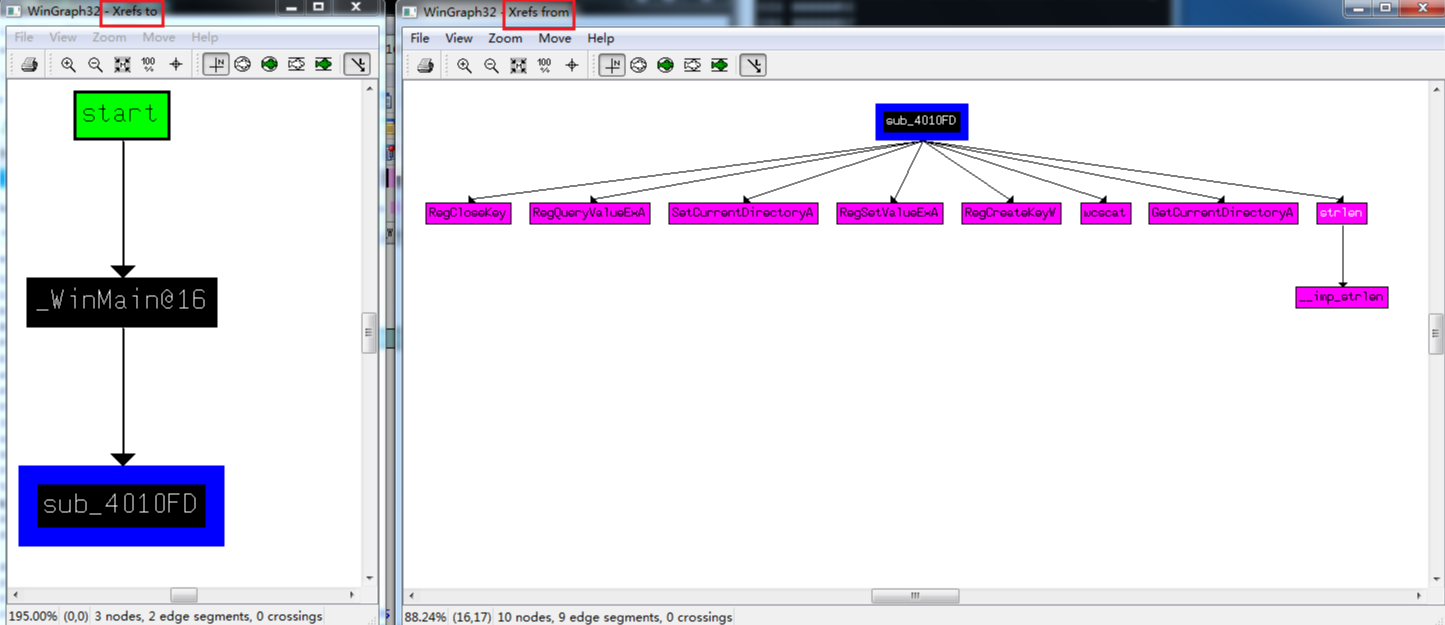
IDA Pro怎么生成函数调用图 IDA Pro如何追踪数据在程序中的传递路径
IDA Pro能帮我们非常清晰地分析程序的结构,生成函数调用图,追踪数据的流动路径等。今天咱们就来聊聊“IDA Pro怎么生成函数调用图”和“IDA Pro如何追踪数据在程序中的传递路径”,让你在逆向分析中更加得心应手。...
阅读全文 >
 汽车安全
汽车安全  金融保险
金融保险  游戏开发
游戏开发  网络安全与防护
  工业4.0应用升级产业
  渗透测试
渗透测试  教育
教育  知识产权
知识产权 司法鉴定
司法鉴定 